Japan was the talk of the capital market last week, with Nikkie falling more than 1500 points in single day and post Lehman era scare was running down the streets. Indian Markets were also affected in global mayhem and Nifty falling and closing below 6000. Next week in May F&O expiry and market is bound to remain volatile, hence trade with caution. Traders can access the following link to see Japan Stock Market Real time Charts.
Last week we gave Trend Deciding level as 6222 Nifty made a high of 6229,collapsed achieved all 3 weekly targets on downside
Nifty Hourly Chart
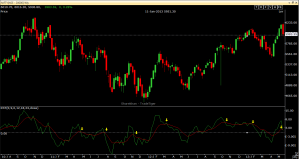
Nifty Hourly charts is trading in prefect channel and very near to 200 HSMA, Last time it consolidated near 200 HMSA and gave a big rally on upside will this time be different?
Nifty Gaps
For Nifty traders who follow gap trading there are 1 trade gaps in the range of 5400-6000 and all other gaps got filled.
- 5836-5853
- 5477-5446
- 6094-6081
Nifty Daily Chart
On Daily chart Nifty has broken the up trending channel and closed below 6120 which was breakout levels putting brakes on the rally.Negative divergence has played it effect.Strong support lies in range of 5940-5900 as nifty has bounced several time from this range as shown in below chart. Shorts can do partial profit booking in this range.
Fibonacci technique
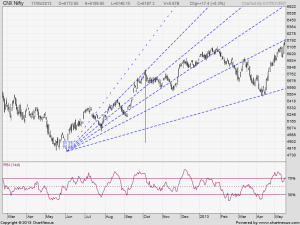
Nifty Fibonacci fan are wonderful tool to find the top and bottom in short term.Last Week.Nifty was unable to sustain above Fibo Fans and gave the much expected pullback 🙂
Fibo Retracement
As per of Fibo Retracement theory Nifty took support at 5941 on Friday which is 38.2 % retracement from 5477-6231. Below 5941 next stonf support comes at 5854
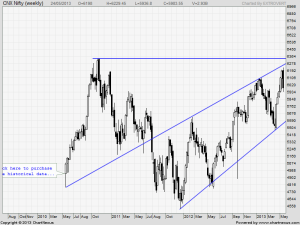
Nifty Weekly Chart
Trading Monthly charts
Monthly charts have given a failed breakout, we need to wait for monthly closing for confirmation. Bears will try to close nifty below 5865 before 31 may
Nifty Trading Levels
Nifty Trend Deciding Level:6001
Nifty Resistance:6050,6095 and 6160
Nifty Support:5941,5892and 5840
Levels mentioned are Nifty Spot
Let me go by Disclaimer these are my personal views and trade taken on these observation should be traded with strict Sl
Want to see post in your Inbox,Register by adding your email id in Post in your Inbox section
Follow on Facebook during Market Hours: https://www.facebook.com/pages/Brameshs-Tech/140117182685863


Dear Bramesh,
How do you calculate the daily trading levels for nifty?
Why don’t you provide levels for first day of trading? (Monday?)
Dear Prashant,
Levels are as per my trading system. I publish weekly views on Sunday so the reason not to post FII Data analysis on Monday.
Rgds,
Bramesh
Sir What is importance of 5865 level in nifty for bears ?
Dear Amol,
5865 is an important support..
Rgds,
Bramesh