
Trading in stock markets will be volatile in Holiday shortened week and March Derivative expiry, Political Uncertainty after DMK pullout on local front and Cyprus Bailout worries on Global front are added flavors for next week trading .Stock prices whipped on downside in volatile week and Nifty ended down 2.8% or 221 points WoW basis. The bloodshed in mid and small-cap space continued with stocks down between 20-45%.
Stock markets will remain shut on Wednesday and Friday on account of ‘Holi’ and ‘Good Friday’, respectively.
Last week we gave Trend Deciding level as 5880 Nifty made the high of 5864 turned back, achieved all the weekly targets on downside. Traders following Weekly trend deciding level should have minted good money.
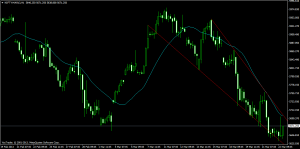
Nifty Hourly Chart
Nifty Hourly charts is forming a falling wedge pattern which is a bullish pattern and will get active once Nifty starts trading above 5693. Till it remains below this level trend will remains sell on rise with intraday rallies.
Nifty Gaps
For Nifty traders who follow gap trading there are 1 trade gaps in the range of 5700-6000 and all other gaps got filled.
- 5872-5863
Nifty Daily Chart
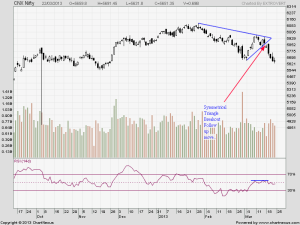
Nifty daily chart is taking support at the red Horizontal line support level as seen in below chart.Nifty is unable to break its 50 SMA on closing basis for 8 times in a rown from Feb 8, making 50 SMA@5937 as the zone of resistance for Nifty.Crossing the same Index has another test at 5971. On Downside below 5785 Index outlook turns bearish with the possibility of a decline to 5,679 or 5,511 in the upcoming weeks. This is what we discussed last week and 50 SMA did the trick for us 🙂
Nifty has broken the symmetrical triangle pattern on downside as shows in below chart. Target of symmetrical triangle comes at 5525.
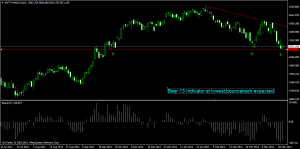
Nifty Bear Indicator is trading at -180 odd levels which suggest deep oversold range, Last time it touched the level Nifty gave 200 points rally. Same can be repeated this time as we are near to important support of 5620 also.
Fibonacci technique
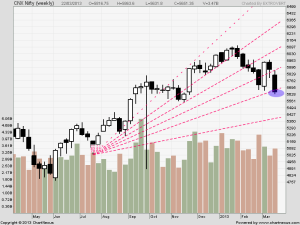
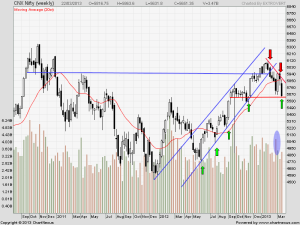
Nifty Weekly chart took support at Fibo Fans trendline another indication we are getting that downside is limited and we can see a counter trend rally.
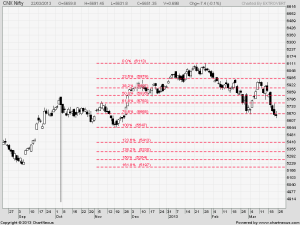
Fibo Retracement
As per of Fibo Retracement theory Resistance at 5664 which is 80% retracement holding and closing above the same bounceback can be seen
Nifty Weekly Chart
Trading Monthly charts
Monthly chart declined after taking resistance at 6112. Till Nifty does not cross 6034, Monthly charts will remain bearish.Analyzing Higher time is always beneficial for positional traders. So net on net Shorts should be booked 80% and no longs should be taken till it moves above the level of 5693 in next 2 days of trading.
Nifty Trading Levels
Nifty Trend Deciding Level:5620
Nifty Resistance:5693,5730 and 5762
Nifty Support:5580,5555 and 5520
Levels mentioned are Nifty Spot
Let me go by Disclaimer these are my personal views and trade taken on these observation should be traded with strict Sl
We do discussion is Live market to update Nifty levels If you are interested you can LIKE the page to get Real Time Updates.
Follow on Facebook during Market Hours: https://www.facebook.com/pages/Brameshs-Tech/140117182685863




very nice and realistic analysis. explained all possibilities. sir pl. write and explain in simple way to understand options basics then using options to understand the trend of nifty. thank you
Thanks, Sure will write an article on the same.
Rgds,
Bramesh