Bears kept ruling the Dalal Street for 3 week in row as Sensex and Nifty closed at 2013 low, with Nifty closing with cut of 0.3%, .Headline Inflation cooled off to 6.6% lowest in Jan with Core Inflation also coming at 4%, IIP data continued to be dismal at -0.6%. Moody warning of widening CAD has fizzled the optimism of improvement in Inflation. Budget is coming near and stock specific action will be name of the game.
Lets discuss Nifty Trading Strategy for Next week.
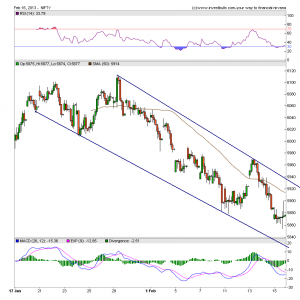
Nifty Hourly Chart
Nifty is trading below 50 SMA which lies at 5914. Nifty made a brief move above 5969 to fall back below Weekly Trend Deciding level of 5945 and made a low of 5854. Traders following weekly analysis would have been able to make some good money.
Nifty Gaps
For Nifty traders who follow gap trading there are 1 trade gaps in the range of 5700-6000. Most of the gaps have been fulfilled in current correction only 1 is reaming
- 5727-5736
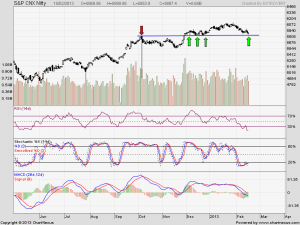
Nifty Daily Chart
Technically till 6100 is not broken on closing basis Nifty will continue with its trend of Sell on Rise . This is what we discussed in Jan 25 analysis and Nifty made a High of 6112 after RBI rate cut and again turned back and made low till 5853 hope traders made use of analysis were able to benefit out of the fall.As seen in below chart Nifty and Sensex both have broken the 8 months old Trend line green color which it was holding from the low of 4770 on both weekly and daily basis, which is a bearish sign.
Next level of Support comes at 5830-15 range which has been resistance in past. Resistance become Support as per classical technical analysis.
Nifty Daily Chart with Indicators
Positive Divergence can be seen in Daily charts in RSI and Stochastic as seen in above chart. So bounceback should be expected from 5838-5815 range. Traders carrying shorts better to do profit booking in the range.
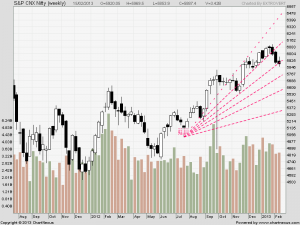
Fibonacci technique
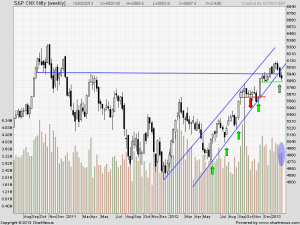
As discussed earlier Fibonacci fan helps in finding potential tops and Bottom of market from short term prospective.We have used Weekly chart and applied Fibo Fans, Nifty was unable to close below the Fibo Fans support of 5880 which is positive signs for Bulls, Now let for confirmation with a follow up move next week.
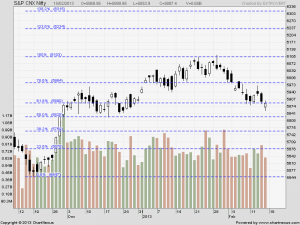
Fibo Retracement
Next week Golden Ratio level of 5890, Nifty broke below it made low of 5854 and unable to close above it. Trading below 5890, 5825 which is 50% retracement should come. Bull market bounces from 50% Fibo levels.
Nifty Weekly Chart
Trading Monthly charts
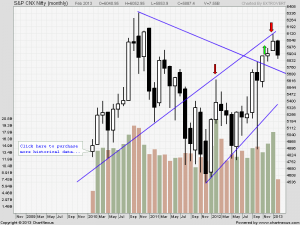
Monthly chart declined after taking resistance at 6112. Till Nifty does not cross 6034, Monthly charts will remain bearish.
Nifty Trading Levels
Nifty Trend Deciding Level:5915
Nifty Resistance:5970,6027 and 6075
Nifty Support:5854,5830 and 5815
Levels mentioned are Nifty Spot
Let me go by Disclaimer these are my personal views and trade taken on these observation should be traded with strict Sl
We do discussion is Live market to update Nifty levels If you are interested you can LIKE the page to get Real Time Updates.
Follow on Facebook during Market Hours: https://www.facebook.com/pages/Brameshs-Tech/140117182685863

