The purpose of trading is to make money. Every action should bend to that goal. That does not mean every trade makes money. It means every trade gets to closer. If you are looking for comfort, get a teddy bear. If you are looking to be right, play trivial pursuit. If you want excitement, drive fast.
Ranbaxy
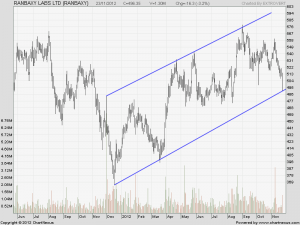
Ranbaxy is near its long term channel support of 490. Stock has been in downtrend from 560. Stock looks ripe for bounce if 490 is not broken.
Buy above 501 Tgt 509,516,525
Sell below 490 Tgt 486,480 and 476
Reliance Capital
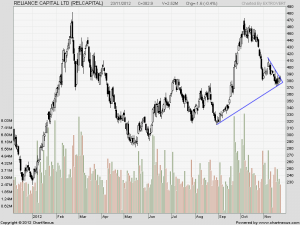
Reliance Capital pennant technical analysis where after a big downtrend from 468-369 stock is consolidating in a small range of 379-387 and breakout or breakdown is on cards.
Sell below 377 Tgt 374.6,370 and 360
Buy above 383 Tgt 387,391 and 395
IDFC
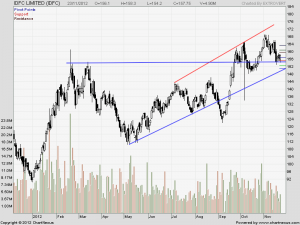
IDFC is classic case of resistance becoming support. As seen in chart above 153 was a strong resistance and now acting as a strong support.
Buy above 158.9 Tgt 161.2,163.4 and 166
Sell below 156.6 Tgt 155.2,154.2 and 153
All Levels mentioned are Spot levels. Trade with a Sl of 0.5-1% as per your risk profile. Trade as and when level comes. DO’nt chase the trade


Thanks for your useful information.Because of this article, I came to know the levels of Ranbaxy,Reliance Capital and IDFC.