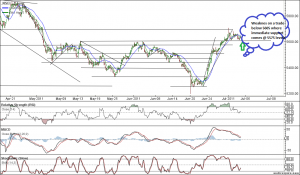
Nifty Hourly
Nifty hourly is taking a breather after 8 days of non stop rally. Bulls are unable to capitalize on the sound fotting they got on June end month.
Signs of Exhaustion are visible on Hourly and daily charts with Nifty trading in a tight range from 5682-5606 from past 3 days.
Market will soon breakout on either side ie.
Break below 5606 Will take it quickly to 5575(Hourly Support) and 5550.
Break above 5705 will take Nifty to 5750 Levels.
Trade light till this range does not break.
Nifty Daily
 On Daily Chart Nifty closed below 5637 which signifies Bulls are exhausted and looking for a breather and Bears can capitalize on the down move or much anticipated Pull back.
5606 Holds the key for bear as shown in above chart with GREEN LINE. Resistance becomes support in down move.
Levels to Trade tommrow
Buy above 5634 Tgt 5660,5682 and 5706
Sell below 5607 Tgt 5587,5562 and 5550
Levels mentioned are Spot Levels.
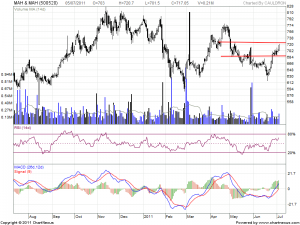
Mah&Mah
Range bound trade with a double top formation in sight.
Buy above 725 Tgt 732,738 and 743
RELIANCE
 RIL is again in news for all Bad reasons and Bears are breaking this stock and Nifty unable to move above 5700.
First Bearish indication stock unable to close above 882 which was its breakout level
MACD is giving Sell signal
Bearish Engulfing formed today making way for more Downside.
Sell below 844 TGT 836 and 828
Below 828 Stock will see a severe fall below 828 as its hits a new 52 Week Low.


sir,
Hope your range is more accurate
regards
govind
Thanks Govind Sir,