


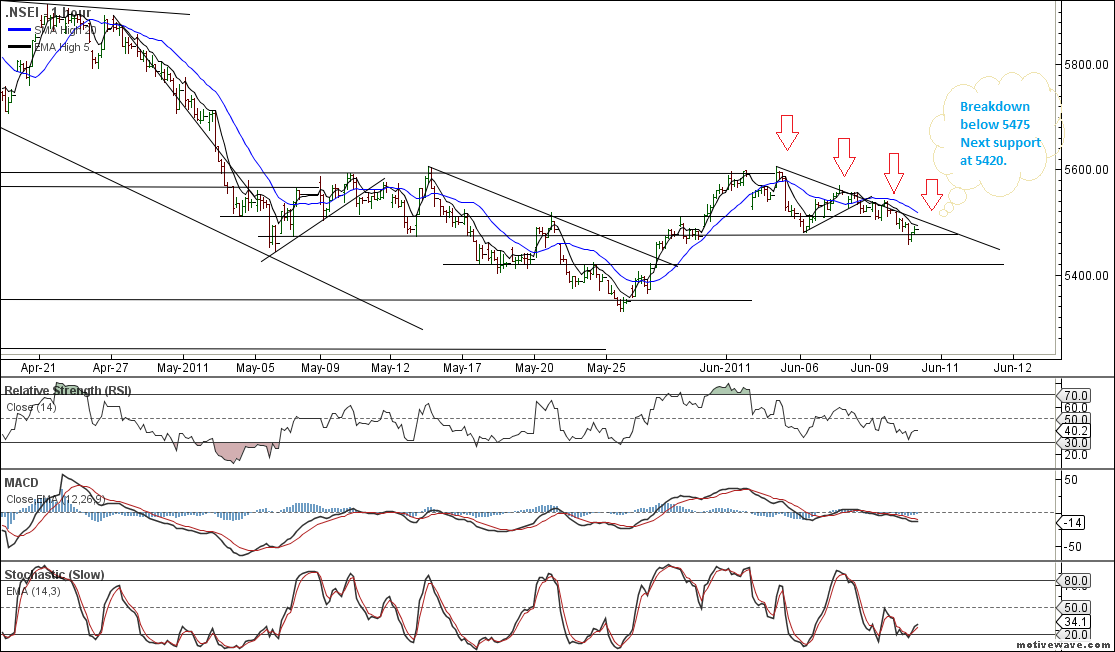
Nifty Hourly Chart
")
Nifty hourly gave a breakdown after 5 days of sideways move 😉 and gave a downmove till 5450 where we told the support lies in our previous post.
IIP data gave a most awaited downmove for the Nifty.5450 and 5420 are again cluster of support present.
As a Trader you need to get adapted to what market wants you to do not what you want.
Nifty Daily

Nifty daily chart has broken the 50% retracement Now support at lower levels comes at 5434 and 5393 as shown in the chart.
 On Nifty daily chart trendline support comes at 5455 level.IF 5455 is supported and 20 SMA is observed than we can see a upmove till 5570 levels.
Nifty Weekly

Weekly Chart Nifty took support at blue trendline drawn. Volumes are on lower end.Past 3 weeks Nifty has not shown a move above 1% on weekly charts.
Sideways move should come to an end this week based on outcome of RBI policy
Levels to Watch
Nifty Trend Deciding Level:5504
Resistance:5543,5610
Support:5457,5392 and 5328
Dear Bramesh-on daily charts stochastic is on week and rsi showing positive diversions so what should be the outcome of such indicators>
Dear Hitesh Sir,
Divergence should not be considered till we see a price action. So if nifty continue its downward journey this week
RSi divergence shall be negated.
Rgds,
Bramesh