India VIX
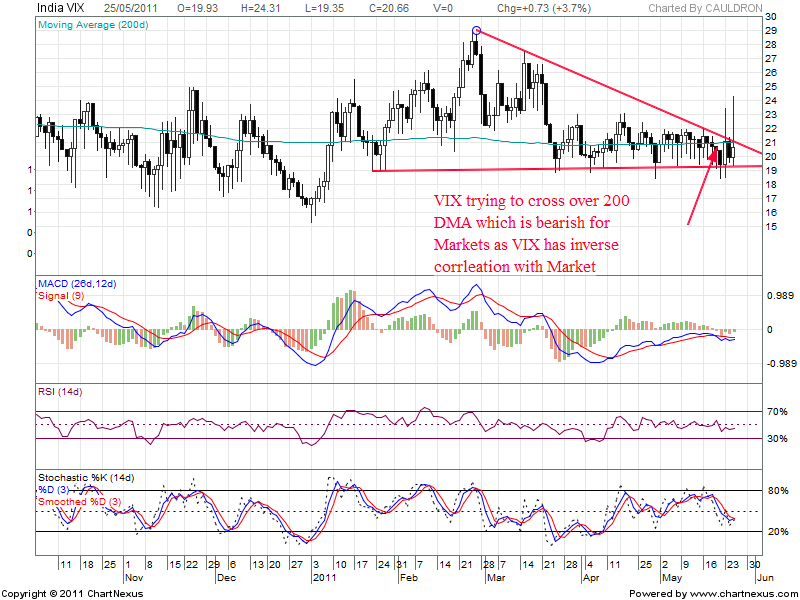
VIX is the fear factor it and it signifies the the market volatility and prone of falling. VIX has inverse correlation with Nifty.ie. If VIX rises Nifty falls and vice versa. Live VIX CHART(Click on Link to see Live VIX chart)
As seen from above chart VIX is trying to cross 200 DMA@21. I it moves above 200 DMA it will enter in Bullish region which will have bearish implication on Nifty.
So have a close Watch on VIX for Nifty moves.
Nifty Weekly
Nifty Weekly chart has broken the Important Short term trendline on Weekly chart and closes below it.
Nifty has broken the Flag and Pole Pattern on Daily charts which has is the region for fall from past 3 trading sessions.
Trading is more of Psychological in nature Let me explain with example
Today is Expiry day Nifty has been in range of 5785-5328.
Bulls who have taken position around 5700-5600 levels will be under presuure of squaring of there positions and Bears for whom Nifty positions are in profit ,so they can carry there profit to next series.
So now if Bulls starts squaring off there positions market will fall on its own weight without real selling.So it gives a Bearish stance for the day. So think general public perception before you start your trading day and Always have Plan B ready if things does not market as you thought.
Bottom line Market is Supreme Never Fight with it
Levels to Watch
Buy above 5355.6 Tgt 5361,5375,5389,5400 and 5416
Sell Below 5328.70 TGt 5322,5295 and 5261
Bank Nifty
Bank Nifty is trading at a very crucial junction and on verge of breakdown from Flag and Pole pattern.
Bank Nifty is trading end of lower end of and break of 10338 will lead to big downfall in Bank Nifty.
Keep an EYE on bank Nifty Today if it is unable to break 10338 than we can rally else fall in Nifty/bank Nifty is imminent.
Market was consolidating yesterday and adjusting the oversold short term pattern.
Stochastic is still trading below 20,Hence Rallies should be used to exit longs and create fresh shorts.
Close above 10724 will nullify the bearish scenario we are talking about.
Selling is evident from the fact that bank Nifty is unable to retrace 23.6% retracement from fall of 11991 to 10339.
Sell Below 10339 Tgt 10272,10169 and 10061
Raymonds
Trend line Support to Raymond and Support becoming resistance a Classical example.
Buy above 346.50 Tgt 350 and 353


Hi Sir,
I m holding 5400 PE JUn series ,last miute nifty crossed 5400 level …kindly let me know the SL for the Nifty short…
as I am thinking 5429 as my SL pls suggest
Hi AbshiekJI,
Please keep Sl of 5445 Nifty Spot on closing basis.
Rgds,
Bramesh
sir,
congrats 5391 touched
regards
govind
Thanks Govindji