Tata Steel
Tata Steel daily has formed Hanging Man Candlestick on Daily charts.
Hanging Man
A bearish candlestick pattern that forms at the end of an uptrend. It is created when there is a significant sell-off near the market open, but buyers are able to push this stock back up so that it closes at or near the opening price. Generally the large sell-off is seen as an early indication that the bulls (buyers) are losing control and demand for the asset is waning.
If we look at Daily charts Resistnce zone is at 638. RSI and Stochastic are overbought zone.
Hourly Charts see the formation of Channel and resisting at top of channel @638.
Sell around 638 Tgt 635,630.44 and 626
HINDALCO INDUSTRIES
Hourly Chart
On Hourly Charts has generated a SELL @215
Daily Chart
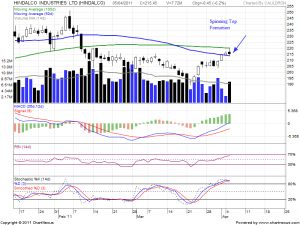
Hindalco is forming spinning top formation,
A spinning top is indicative of a situation where neither the buyers nor the sellers have won for that time period, as the market has closed relatively unchanged from where it opened; the market is indecisive regarding its trend.When a spinning top forms after a run up or run down in the market, it can be an indication of a pending reversal, as the indecision in the market is representative of the buyers losing momentum when this occurs after an uptrend and the sellers losing momentum after a downtrend.
Hindalco is locked in the range between 50 SMA and 100 SMA. Break on either side will give a trading gains
Sell below 213.65 Tgt 211.7 and 209.9


