SBIN Daily Chart
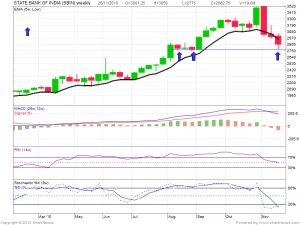
SBI is forming an ascending triangle formation with support around rs 2780 levels and resistance around 5 EMA 2905 levels.
Stock has fallen from a high of 3400 to a low of 2700 in a matter of few trading sessions and a bounce till 3000 can be excepted for the stock.
RSI,MACD and STOC are oversold on charts on both daily and weekly
SBIN Weekly Chart
Buy above 2862 Tgt 2895,2917,2972 and 3035
TCS Daily Chart
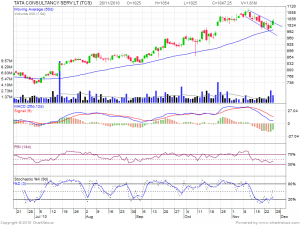
 TCS has staged a sharp pullback from the support of its 50-DMA this week (as seen in the chart). It also attempted to break past the
resistance level of Rs1,050 with higher-than-average volumes.
Despite the volatility in the broader indices, the stock is sustaining above the downward sloping breakout trendline, suggesting
strength in the counter and any move past Rs1,054 is likely to accentuate buying momentum in the near term.
RSI too has bounced back from the support levels of 40 which favors risk reward ratio on the bullish side.
TCS Weekly Chart
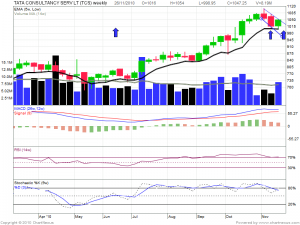
5 EMA has provided a strong support on daily charts as seen above.
Buy above 1054 Tgt 1071 and 1088
AXIS BANK
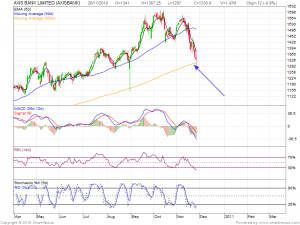
 Axis bank has been hammered with other banking stocks in the recent correction and stock is trading near its 200 DMA.
200 DMA is considered as a crucial for traders as it seprates bull and bear market for a stock.
Axis bank 200 DMA lies at 1309 levels and should act as a good support for coming week.
Technical Indicators are in deep over sold regions and dead cat bounce can make this stock to trade higher levels for coming week
Buy above 1332 Tgt 1345,1366,1401 and 1436


Thanks for detailed analysis. Good calls. Already bearing fruits as I write this. Keep it up.
I posted up a Boatload of Charts for those interested, lots of new posts so please scroll down as needed.
http://oahutrading.blogspot.com/
Also posted a funny “What’s wrong with the world today” piece, please add to it.
http://oahutrading.blogspot.com/2010/11/its-all-good.html