*About Bull Market Corrections**
We look back to 17 years of market (BSESensex) history to assimilate data on bull market corrections. There have been four bull markets over the past 17 years (including the current one), and within those bull markets there have been 32 corrections of 5% or more (including the current one). The average fall during these corrections is 12%, and the average duration of these corrections is 16 days. The worst fall (May-June 2006) was 31%, whereas the longest fall (July to September 1993) lasted 28 days. The standard deviation from the average fall is 5.6%.
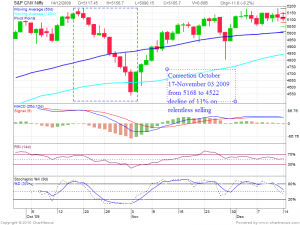
The Ongoing correction look’s similar to October 17-November 03 2009 Correction
 [Please click on the image to see larger image]
As seen on above chart there was relentless selling by FII’s and Nifty without even bouncing back gave a decline of 11.2%.Fall started with a faster pace with a breakdown of 50 DMA and got arrested around 100 DMA as shown in chart.
On Going Correction 08 Nov- till date
 [Please click on the image to see larger image]
As seen in the above chart Nifty topped around 6332 and yesterday made a low of 5799. Fall again accelerated by the break of 50 DMA and today we should touch 100 DMA@5762.If our EOD closing is above 5762 and we can sustain over it for next week as we are near 100sma/ Monthly channel supports(5750-5760) we can see the end of correction and take a march forward for a new high in December series. Looking at the similarity of the above 2 charts
Will History repeat itself Will come to in next week Trading
Guys use the Following Pivot Point Calculator for getting Pivot,Caramilla Levels for Nifty/Stocks http://pivotpointscalculator.blogspot.com/
