Nifty Trading System as i have discussed few months earlier generated a sell signal @6090 and still now in Sell Mode.Last time it generated a buy signal was 5473 and trade made a high of 6284,but i do not think that anyone had so till high levels and with this trading system we need to book profit as per our discretion.
As of now we made a low of 5935 and with this sell call generated and i would advise trader to book profit if we are unable to close above 6055 on Spot else book nominal profits.
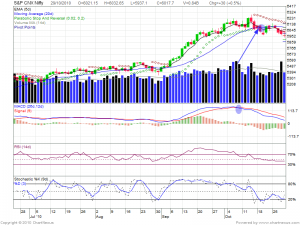
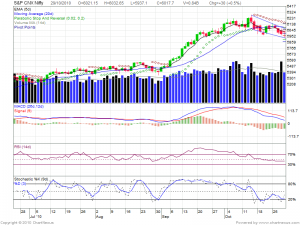
 Nifty Daily Charts
After hitting a high of 6284 we are seeing a correction in the rally which started from 5400 levels.Looking at daily chart we are in downtrend and till we stay below 6075 we can see more downwards levels till 5800 Levels.
 Next week is quiet interesting in terms Economic Data as we will have Fed announcing the QE II and RBI giving decision on rate hike.
Technical Indicators MACS is in Sell zone and RSI is nearing oversold region.
Lead Indicator STOC is in oversold zone and we can except a good bounce back but we need to see if it can be sustained or not.
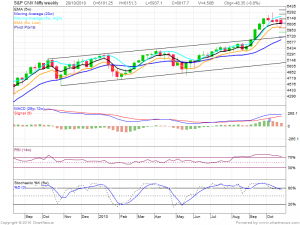
Nifty Weekly Chart
Looking at Nifty Weekly chart and applying 5 EMA trading system we can come to range of 5935-6160 which are respectively 5 EMA Low and 5 EMA high for the Nifty.
So we have the trading Range of Nifty till either
5975 or 6040 are no trading zone
Once nifty either start trading above any of these levels positions should be take
On Upside 6055/6090/6160 levels
On Downside 5955/5935/5895
Looking at Option data 6500 CE has 15 lakh OI which suggests if we have positive news than this levels can be achived in this Expiry.
All Nifty Levels mentioned are SPOT Levels.

