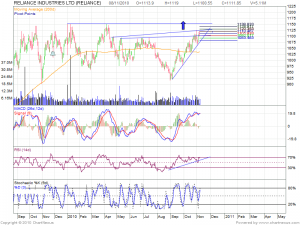
Reliance Daily Chart
Reliance Daily Chart is showing a bullish breakout with rising support and facing resistance around 1119 levels.Stock has remain under performer for the most of the rally,Now as we are at the most crucial juncture of the rally moving to all time high RIL can play a crucial role.
It’s a throw-back to the Mark Douglas style of trading/analysis as described in Trading in the Zone where he states you should formulate trades based on massive support or resistance areas that price HAS to break one way or the other. Your trade is then the direction of the resolution – downward from resistance or upward on a break.
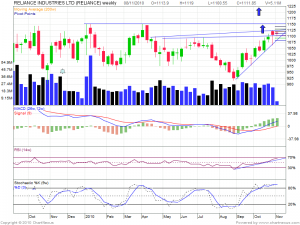
Reliance Weekly Chart
On Weekly Chart we have support of 1105 and resistance at 1119- RSI is at 92, trading in overbought territory on Daily Chart, showing positive crossover indicating uptrend.
- Stochastic is at 27, just entered into neutral territory from oversold, moving upward.
- Stock is trading above 5 and 20 day EWMA, indicating upside.
- Expecting sharp upside if level of 1,150 breaches decisively
Buy above 1120 Tgt 1130,1150 and 1170
Sell below 1105 Tgt 1092 and 1083


