Coming week will be a a crucial week for markets, as IIP-data for Feb.2010 will be announced on Monday 12th Apr, consensus estimate is 15.75% as compared to 16.7% previously. Lower IIP for feburary could prove to be a dampner. Following day on Tuesday 13th Apr, IT major INFOSYS will kick-start earning season for Indaian corporates. On 14th Apr markets have holiday and this will be followed by Monthly Inflation data for March to be announced on 15th.
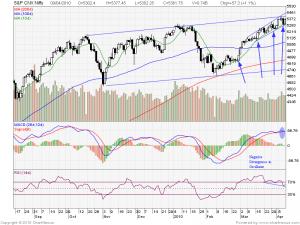
- 10 Day Simple moving Average (DMA) is constantly performing as reliable support around 5300. A short term downtrend can only be expected if Nifty trades below 5300 for consecutive 3 days.
- Nifty for the past few trading sessions is trading within an upward channel. This is a trading zone between two parallel trend lines in which Nifty moves inside a range as upper band acting as resistance and lower band acting as support. The upper trend line connects highs, and the lower trend line connects lows. Breakout to any of the two sides can be expected. Lower band has provided support in the last week itself from the major downs.
- MACD and RSI are showing negative Divergences as indicated in Daily Chart.
- Volumes are not rising much and still belongs to the lower side. But On-Balance volume indicator is moving vertically upside indicating accumulating occurring in Nifty. This means that volumes are higher on the bullish days and lower on the bearish days indicating less selling happening on the down days while huge buying happening on up days.
Resistance @ 5392 5437 5367 5487 5574
Support @ 5316 5300 5274 5214 5186
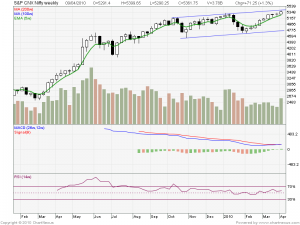
On Weekly Charts we can see Positive divergence in MACD and it turns implies that we are having a bullish undertone an dips till 5300 should be used to buy.As on Weekly Chart we are approaching top end of Trendline we may get few dips or correction till 5300 which should be used to buy the index keeping a sl of 5274.


