What is an Oscillator
An oscillator is a leading technical indicator which fluctuates above and below a center line and normally has upper and lower bands which indicate overbought and oversold conditions in the market (an exception to this would be the MACD which is an Oscillator as well).
What is RSI
The RSI is best described as an indicator which represents the momentum in a particular Stock or Index when it is reaching extreme levels to the upside (referred to as overbought) or downside (referred to as oversold) and is therefore due for a reversal. RSI Bands are placed at 70 which is considered an extreme level to the upside, and 30 which is considered an extreme level to the downside.
RSI Calculation
100
RSI = 100 – ——–
1 + RS
RS = Average Gain / Average Loss
This RSI calculation is based on 14 periods, which is the default suggested by Wilder in his book. Losses are expressed as positive values, not negative values.
The very first calculations for average gain and average loss are simple 14 period averages.
First Average Gain = Total of Gains during the past 14 periods / 14
First Average Loss = Total of Losses during the past 14 periods / 1
The second, and subsequent, calculations are based on the prior averages and the current gain loss:
Average Gain = [(previous Average Gain) x 13 + current Gain] / 14.
Average Loss = [(previous Average Loss) x 13 + current Loss] / 14.
Example of RSI
-
To Identify and potentially overbought Index/Stock
When Index Trades above 70 it is overbought.Opportunities to go Short
-
To Identify and potentially oversold Index/Stock
When Index Trades below 30 it is oversold.Opportunities to go Long
- RSI Indicator Divergence
A second way that traders look to use the RSI is to look for divergences between the RSI and the financial instrument that they are analyzing, particularly when these divergences occur after overbought or oversold conditions in the market. These divergences can act as a sign that a move is loosing momentum and often occur before reversals in the market. As such traders will watch for divergences as a potential opportunity to trade a reversal in the stock, futures or forex markets or to enter in the direction of a trend on a pullback.
Below is Chart of Negative Divergence:Nifty making New High But RSI falling Toppish Sign
Below is Chart of Positive Divergence:Nifty making New Low but RSI rising,Showing we are near Bottom.
- RSI Indicator Centerline Crossover
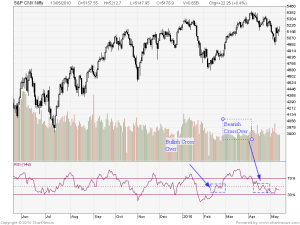
RSI is to identify bullish and bearish changes in the market by watching the RSI line for when it crosses above or below the center line. Although traders will not normally look to trade the crossover it can be used as confirmation for trades based on other methods.
An up trending market will typically find support at the 40 level, with effective resistance at the 80 level. A down trending market will find resistance at 60, with effective support at the 20 level.
In an 80/40 range (bull market), you will see the RSI make higher tops and higher bottoms – a classical indication of a bull market! Likewise, in a 60/20 range (bear market) you will see the RSI making lower bottoms and lower tops.


