I am not a SEBI Registered Advisor, and the analysis provided on this website is intended solely for educational purposes. It is important to note that the information presented should not be construed as financial advice. We do not guarantee the accuracy or completeness of the content, and any decisions based on the information provided are at your own risk.
Please be aware that investing in financial markets involves inherent risks, and past performance is not indicative of future results. We, the authors and contributors, shall not be held responsible for any financial outcomes, including but not limited to profit or loss, arising from the use of the information on this website.
It is strongly recommended that you seek the advice of a qualified investment professional or a SEBI Registered Advisor before making any investment decisions. Your financial situation, risk tolerance, and investment goals should be carefully considered before implementing any strategies discussed on this platform.
Additionally, we may not be aware of your specific financial circumstances, and our content should not be considered a substitute for personalized advice. Always conduct thorough research and consult with your own investment advisor to ensure that any investment decisions align with your individual financial objectives.
By accessing and using the information provided on this website, you acknowledge and agree that you are solely responsible for your investment decisions. We disclaim any liability for any direct or indirect damages, including financial losses, that may result from the use of or reliance on the information presented here.


Fundamentally this company has nothing going for it. And, most shares in the company are held by individuals.
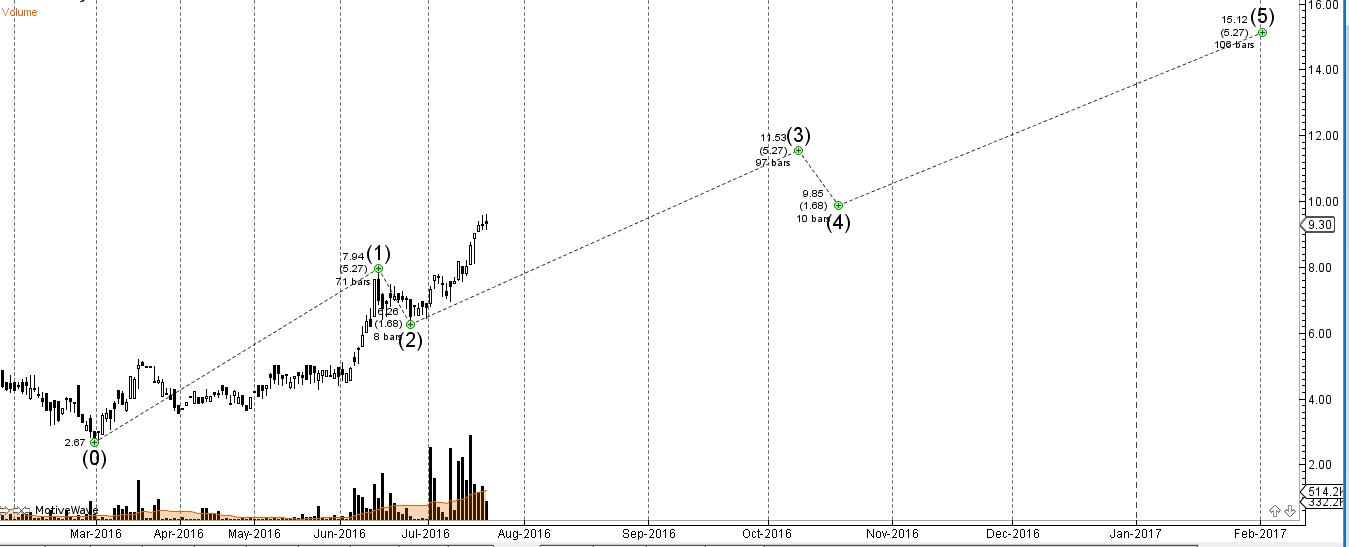
Its a technical call. I have told this when stock was trading at 8 now trading at 10 so till my sl is not triggered am happy to hold. I do not have expertise on FA..
Wouldn’t you be worried with today’s shooting star candle formation?
No i am not worried..
Great analysis.ji.