Overview
On balance volume (OBV) is a momentum indicator, the calculation of which relates volume to price change. OBV was developed by Joe Granville. .OBV provides a running total of volume and shows whether this volume is flowing in or out of a given security. OBV attempts to detect when a financial instrument (stock, bond, etc.) is being accumulated by a large number of buyers or sold by many sellers. Volume is the driving force behind the market, so OBV is designed to project when major moves in the markets would occur and measures the positive and negative volume flow. OBV helps in projecting when major moves in the markets would occur
Calculation
On Balance Volume is calculated by adding the day’s volume to a cumulative total when the security’s price closes up, and subtracting the day’s volume when the security’s price closes down.
- If today’s close is greater than yesterday’s close then:
OBV = Yesterday’s OBV+ Today’s Volume (considered up volume)
Up volume occurs when a stock finishes a day of trading at a level higher than its open, meaning that the trading volume for the day was more bullish than bearish.
- If today’s close is less than yesterday’s close then:
OBV = Yesterday’s OBV – Today’s Volume (considered down volume)
Down volume occurs when a stock finishes a day of trading at a level lower than its open, meaning that the trading volume for the day was more bearish than bullish.
- If today’s close is equal to yesterday’s close then:
OBV = Yesterday’s OBV
The chart below shows Soybeans January 2014 with volume and OBV.

Interpretation
On Balance Volume is a running total of volume. It shows if volume is flowing into or out of a security. When the security closes higher than the previous close, all of the day’s volume is considered up-volume. When the security closes lower than the previous close, all of the day’s volume is considered down-volume. The basic assumption, regarding On Balance Volume analysis, is that OBV changes precede price changes. The theory is that smart money can be seen flowing into the security by a rising OBV. The absolute value of OBV is not important. Traders should instead focus on the characteristics of the OBV line. First define the trend for OBV. Second, determine if the current trend matches the trend for the underlying security. Third, look for potential support or resistance levels. Once broken, the trend for OBV will change and these breaks can be used to generate signals. Also notice that OBV is based on closing prices. Therefore, closing prices should be considered when looking for divergences or support/resistance breaks. This method of analyzing On Balance Volume is designed for trading short-term cycles. According to Granville, investors must act quickly and decisively if they wish to profit from short-term OBV analysis.
Trade using OBV
- Bullish Divergences
Bullish divergence signals can be used to anticipate a trend reversal. These signals are truly based on the theory that volume precedes prices. A bullish divergence forms when OBV moves higher or forms a higher low even as prices move lower.
A bearish divergence forms when OBV moves lower or forms a lower low even as prices move higher. The divergence between OBV and price should alert trader that a price reversal could be in the making.
Lets understand the concept with example of Weekly Crude Oil Chart.
As seen in below Weekly Crude Oil Chart Prices are making lower low from $93 to $92 but a closer look at OBV suggests Higher High formation shown with Blue line signalling a Bullish Divergence, The effect of Bullish divergence is seen with Crude Oil jumping almost 5$ to 97 in preceding week.

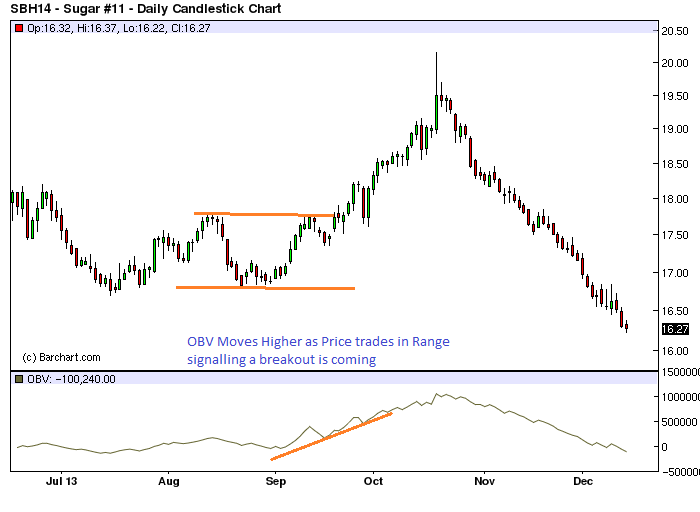
- OBV also signals of breakout when price trades in a range.
OBV helps in understanding the accumulation and distribution pattern and helps is identifying breakout and breakdown in near future. Rising OBV during a trading range indicates accumulation, which is bullish. Also OBV in trading range indicates distribution which is bearish.
Below Daily chart of Sugar shows Sugar trading in range of $16.7-$17.9 for almost 20 trading session, Closer look at OBV reveals OBV has been rising while Prices are trading in range. Bullish breakout soon happens and OBV made a high of $20.

- Bearish Divergence
A bearish divergence forms when OBV moves lower or forms a lower low even as prices move higher. The divergence between OBV and price should alert trader that a price reversal could be in the making.
Let’s understand the concept with example of 15 min Gold Intraday Chart.
As seen in below Intraday chart of Gold on 15 minutes time frame, Gold makes a higher high from $1260-1265 whereas OBV makes a lower low, signalling a bearish divergence. Bearish divergence gets conformation once prices starts trading below $1250 and subsequently corrects till $1220.

- Trend Confirmation
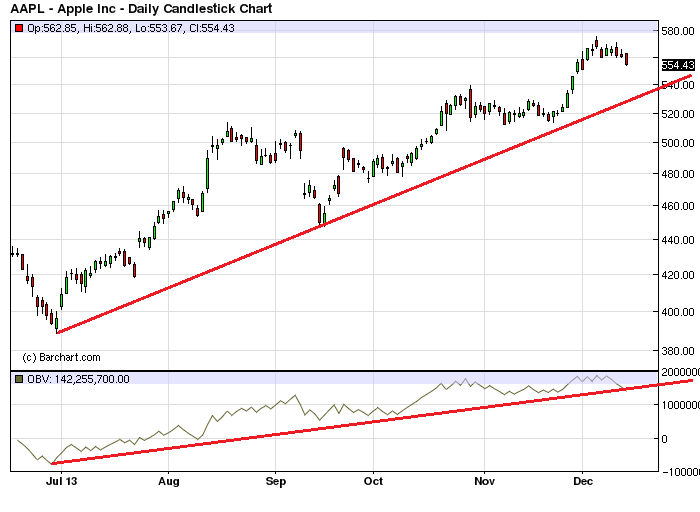
Once a trend is established, it remains in force until it is broken. OBV can be used to confirm a price trend, upside breakout or downside break.
The chart for Apple shows The trends in OBV matched the trend in Apple hence giving confirmation to trader of being on right side of trend.

Conclusion
On Balance Volume (OBV) is a simple indicator that uses volume and price to measure buying pressure and selling pressure. Buying pressure is evident when positive volume exceeds negative volume and the OBV line rises. Selling pressure is present when negative volume exceeds positive volume and the OBV line falls. Traders can use OBV to confirm the underlying trend or look for divergences that may foreshadow a price change. As with all indicators, it is important to use OBV in conjunction with other aspects of technical analysis. OBV should not be used as an standalone indicator and should be used in conjunction with basic pattern analysis or to confirm signals from momentum oscillators.

Is it a lagging indicator bramesh ??
yes its lagging..
i mean default setting for obv comes to be 14,do we need to change it.
brahmesh sir, which parameter we have to set while choosing obv indicator
Use the default one..
Thanks Bramesh. Very useful info
THANKS SIR,
Splendid… Thanks Bramesh…
Bramesh sir , Thanks for knowledge sharing…
Absolutely Excellent Bramesh… Buy or Sell can be decided based on pre indication of OBV. Thanks for info..
Excellent Sir……
Thanks All !! AM happy readers liked the article..