Last Week we gave Chopad Levels of 7979 , Nifty opened gap down below chopad levels and made low of 7556 near the previous swing low of 7551, Shorts Intitated on Monday were rewarded with all three target done by Tuesday.Lets analyses how to trade nifty next week
Traders should work on New Year resolutions and use the below 2 post for planning a successful and profitable 2016.
Traders’ Resolutions for New Year-2016
New Year Resolutions for Trading Success
Nifty Hourly Chart
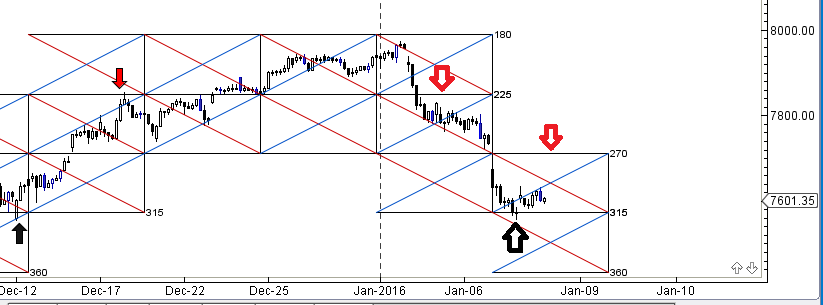
Nifty moved perfectly in pyrapoint angles break support at 225 line, and saw a quick fall till 315 and took exact support at 315 and showed bounce back. Break of 315 @7551 can see fast move till 7430.
Nifty Harmonic
7979/8024 are the 2 levels which needs to be watched next week, Unable to close above it can see Nifty correcting till 7888/7788.
Shark Pattern will get complete around 7503 level where we need to observe the price action. Holding the same we can see sharp bounceback.
Nifty Gann Angles
Break of green line can see fast move on downside.
Nifty Supply and Demand
Self explanatory chart of Weekly Supply and Demand zone is shown,Weekly close below 7563 can see moving towards 7118 levels.
Nifty Gann Date
Nifty As per time analysis 12 Jan is Gann Turn date , except a impulsive around this dates. Last week we gave 06 Jan/08 Dec Nifty saw a volatile move.
Nifty Gaps
For Nifty traders who follow gap trading there are 15 trade gaps in the range of 7000-9000
- 7067-7014
- 7130-7121
- 7276-7293
- 7229-7239
- 7454-7459
- 7963-7937
- 7741-7675
- 8327-8372
- 8937-8891
- 8251-8241
- 8232-8209
- 8116-8130
Fibonacci technique
Fibonacci Retracement
7551/7503/7430 are levels to be watched in coming week.
Nifty Weekly Chart
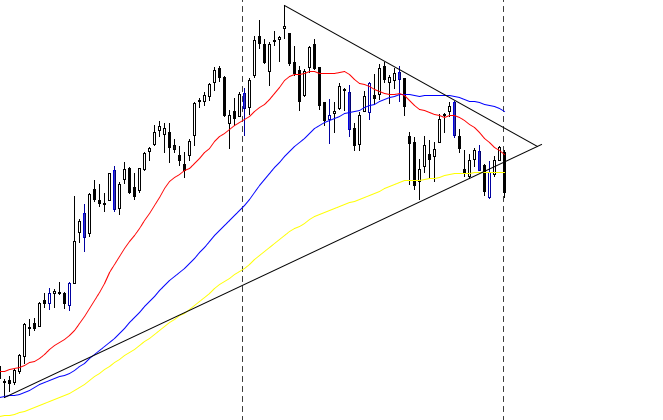
It was negative week, with the Nifty down by 362 points closing @7601 and having worst week from Jan 2011 , again got stop near the middle trendline as shown in 1 chart and closing below its 20 and 100 WEMA and 55 WEMA. Break of 7503 can see fast move till 7430/7360 levels. Time cycle turned again at the dotted line as shown in below time chart.
Trading Monthly charts
Monthly chart took resistance @50% and support near 61.8% retracement line. Break of 61.8% can see fast move to downside.
Nifty PE
Nifty PE @20.56 lowest from Oct 2014.
Nifty Weekly Chopad Levels
Nifty Trend Deciding Level:7555
Nifty Support:7506,7460,7320
Nifty Resistance:7636,7698,7766
Levels mentioned are Nifty Spot
Let me go by Disclaimer these are my personal views and trade taken on these observation should be traded with strict Sl.Please also read the detailed Disclaimer mentioned in the Right side of Blog.
Want to see post in your Inbox,Register by adding your email id in Post in your Inbox section
Follow on Facebook during Market Hours: https://www.facebook.com/pages/Brameshs-Tech/140117182685863
Follow on Twitter during Market Hours: https://twitter.com/brahmesh


NF trade changer lebel
SUPER / SUPERB AS USUAL
Thanks for the terrific analysis. We are on the verge of a major crash globally, rounding top in the weekly nifty targets 6000 long term.
Very good knowledge. Based on your harmonic pattern I made GODREJ INDUSTRIES harmonic pattern. I got targets of 397,400,402. Sir plz let me know it is correct or not. Because I bought GODREJ INDUSTRIES one lot futures in 399.20 levels. Should I wait for 404 levels or quit tomorrow.
Sir kindly explain about chopad levels
Thank you sir
Nifty Harmonic
As discussed Last Week
7979/8024 are the 2 levels which needs to be watched next week, Unable to close above it can see Nifty correcting till 7888/7788.
Shark Pattern will get complete around 8503 level where we need to observe the price action. Holding the same we can see sharp bounceback.
Sir , shark pattern completed around 7503 or 8503?
I m daily reader of your articles.
Really u r doing very good work for traders like us
VERY GREAT KNOWLEDGE BRAHMESH BHAI GOOD ONE PROUD OF U