


Last week we gave Chopad Levels of 7930 , long taken as per Chopad levels got rewarded with 234 points as Nifty did all 1 targets on Upside and all 3 targets on downside. We have trading Holiday on 02 October. Lets analyze how to trade market in coming week where we have RBI policy on 29 Sep.
Nifty Hourly Chart

As discussed last week Nifty hourly EW chart shows if 8055 is not broken we can see downmove till 7800 in coming week.
Now if 8000 is not broken on closing basis we can go down till 7650/7539 and forming new low for 2015.
Nifty Hourly Gann Box

7960/7980 zone is important gann resistance support zone and strong support @4×1 line.
Nifty Pyrapoint

This is what we discussed last week Got Resisted @ 135 degree heading towards 180 @7928 and below that 7800.
For coming week 180 degree @7920 if resisted again nifty heading towards 7787/7623 odd levels.Closing above it heading towards 8000/8080.
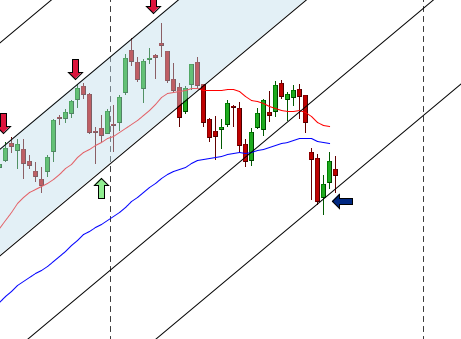
Nifty Supply and Demand

This is what we discussed last week Supply Demand zone caught top @8055 as shown by Blue arrow bow break of 7958 and close below it for 2 days can see nifty going down till 7767.
For coming week 7767 should be closely watched on downside and 7958 on upside.
Nifty Harmonic Analysis

On Medium term Nifty is forming Butterfly pattern which is bullish till 7539/7500 held on weekly closing basis. Use dips to buy from medium term perceptive.
Nifty Gann Date
Nifty As per time analysis 30 Sep is Gann Turn date , except a impulsive around this dates. Last week we gave 21 September/24 Sep Nifty saw a volatile move .
Nifty Gaps
For Nifty traders who follow gap trading there are 15 trade gaps in the range of 7000-9000
- 7067-7014
- 7130-7121
- 7276-7293
- 7229-7239
- 7454-7459
- 7526-7532
- 7598-7568
- 7625-7654
- 7780-7856
- 7927-7940
- 8174-8195
- 8091-8102
- 8322-8372
- 8355-8381
- 8937-8891
Fibonacci technique
Fibonacci Retracement

8097/7965 /7912/7802 should be watched in coming week.

Touched the high of Fibo Fan and retraced back.
Nifty Weekly Chart

It was negative week, with the Nifty down by 113 points closing @7868, and closing below its 55 WEMA and 20 WEMA and held its trendline support as shown in above chart. Time Cycle started on negative note.

Trading Monthly charts

Monthly chart took support @61.8% retracement line and showed bounce back.
Nifty PE

Nifty PE @21.81 , so at last seeing some correction in valuation
Nifty Weekly Chopad Levels
Nifty Trend Deciding Level:7880
Nifty Resistance:7958,8020,8080
Nifty Support:7800,7720,7600
Levels mentioned are Nifty Spot
Let me go by Disclaimer these are my personal views and trade taken on these observation should be traded with strict Sl.Please also read the detailed Disclaimer mentioned in the Right side of Blog.
Want to see post in your Inbox,Register by adding your email id in Post in your Inbox section
Follow on Facebook during Market Hours: https://www.facebook.com/pages/Brameshs-Tech/140117182685863
How we can trade with Chopad Levels?
Buy above Chopad with a 20 point sl or close below chopad level book near resistance and support. Do paper trader for few weeks to get used to system than only put real money..
Sir, You have mentioned that closing below 8000 can lead to new low of 2015. Is it hourly close or daily close?
Thanks
Nifty 7500 on spot levels is a key level which markets should test and decide from there its future course of action. On larger time frames nifty should test 7000 levels to complete its pattern tgt.So we can say that its traders market where one should be nimble footed to catch upswings and downswings.
True, but at this juncture, neither is the (day timeframe) overbought, not has ns closed below key supports. Rally may be seen now…
Bharat@ It would test 7500-7400 before going up much. Max it can touch 8050 but then in that case whole of Oct will be a correction month. so makes sense to first dip and then rise. Brahmesh what do you guess
Sirji pls tell us as per gann analysis when the new bearish time cycle starting from 25sep will end
I will not discuss on time cycle as many people got confused with the same. Only to few traders who understand the risk management concept i discuss the same.
Sirji gm after 14 june to 25sep market was in bullish cycle now from 25 Sep till when this bearish cycle will work pls tell us