


Last week we gave Chopad Levels of 8251 ,Nifty made high of 8423 almost meeting our 3 Chopad Level of 8446 Lets analyze how to trade market in coming week as we also have monthly closing and Greece drama has comes to climax with Alex Tripas asking for referendum which can send shock waves to world financial market.
Nifty Hourly Chart

Now as per Currently Hourly chart was unable to cross the 3×1 gann angle, support lies @4×1 gann line breaking the same can lead to fall near 8200 odd levels. Breakout will come only on hourly close above 8500.
Nifty Hourly Elliot Wave Chart
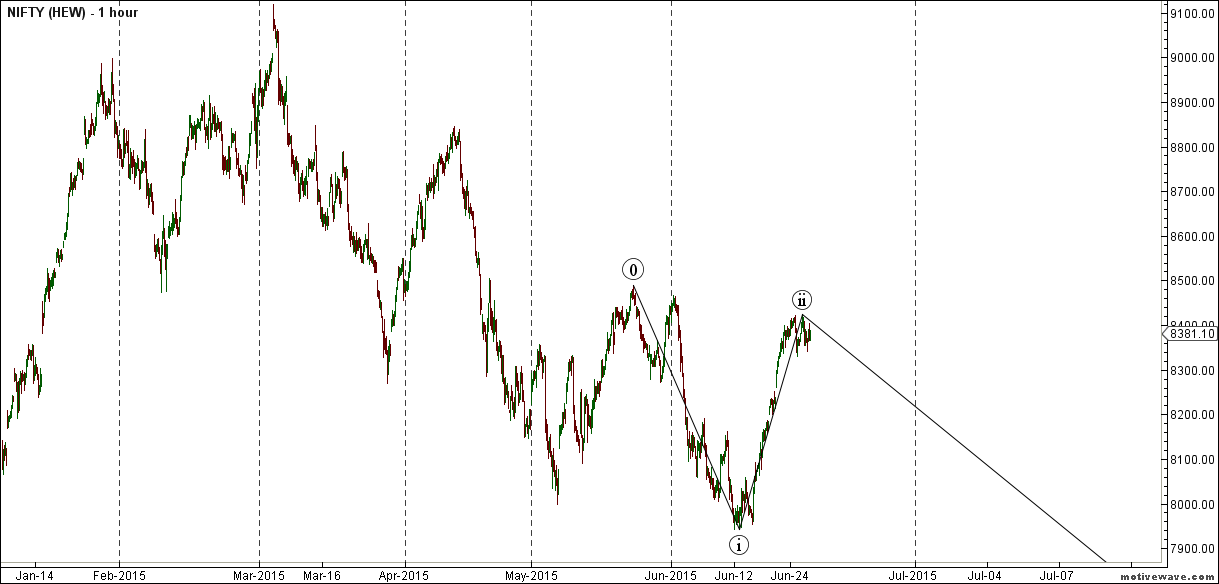
Hourly charts on Elliot wave shows we are done with rise can see pullback near 8200 and below that can see fall below 8000 odd levels in medium term.
Nifty Pyrapoint Analysis

As per Pyrapoint Analysis till 8350 is held @45 degree line bulls are in control,below that 8200 on cards.
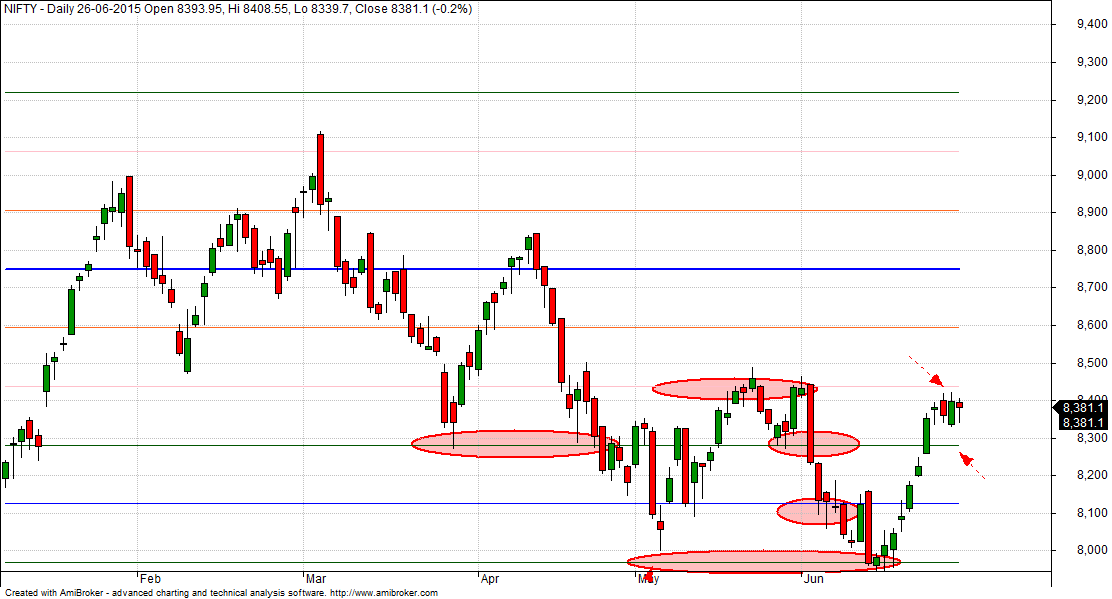
Supply Demand Zone

As disucssed last week 8432 is supply zone, nifty made high of 8423 and started showing pullback.
Nifty Gunner

Unable to corss the green arc suggests we can see pullback till 8200/8250 odd levels.
Nifty Harmonic

Harmonic also suggests if range of 8432-8450 not crossed can see pullback till 8250/8200 odd levels.
Nifty Daily Elliot Wave Chart

As per EW more legs are left to the rally use dips around 8000/7900 to take exposure to quality large and mid caps stocks. NO leveraged positions this for cash market traders.
Traders who bought must have bee rewarded.
Nifty MML
8436 is MML resistance zone and Support at 8283/8126.
Nifty Gann Date
Nifty As per time analysis 29 June/02 July is Gann Turn date , except a impulsive around this dates. Last week we gave 22 June/25 June Nifty saw a volatile move .
Nifty Gaps
For Nifty traders who follow gap trading there are 15 trade gaps in the range of 7000-9000
- 7067-7014
- 7130-7121
- 7276-7293
- 7229-7239
- 7454-7459
- 7526-7532
- 7598-7568
- 7625-7654
- 7780-7856
- 7927-7940
- 8174-8195
- 8091-8102
- 8224-8257
- 8365-8391
- 8937-8891
Fibonacci technique
Fibonacci fan
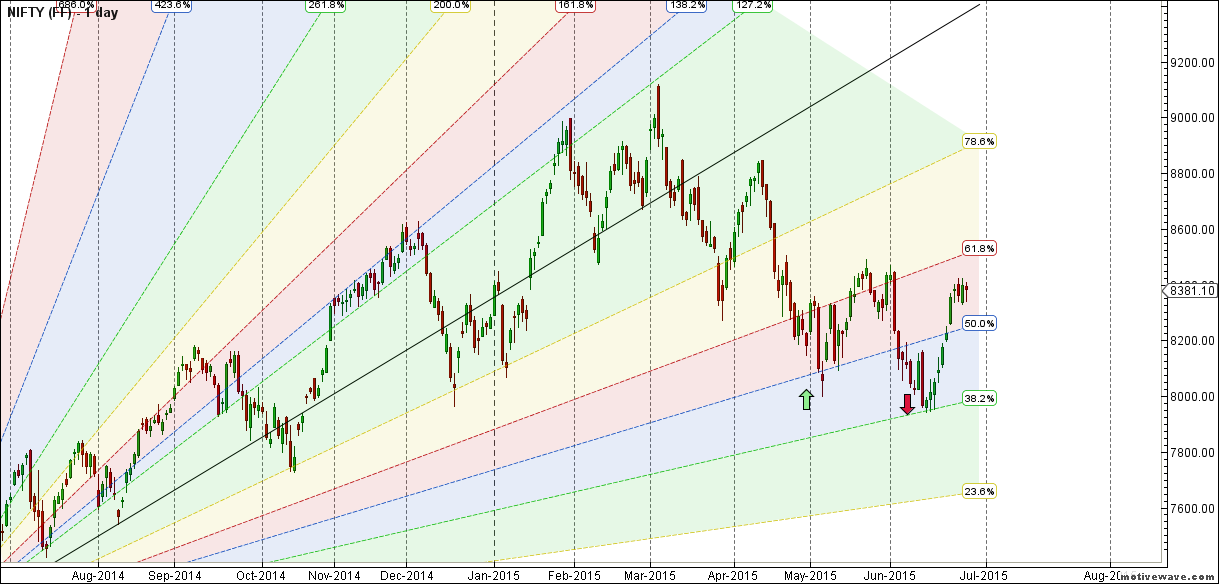

8286-8216 and 8499/8524 is fibo retracement as shown above are important level to be watched in coming week.
Nifty Weekly Chart

It was positive week, with the Nifty up by 156 points closing @8381 , and closing above its 55 WEMA and below its 20 WSMA. Nifty has bounced sharply 483 points in past 12 trading sessions based on oversold nature of Weekly chart and positive divergence, Now has been consolidating in range of 8329-842, break of any of the 2 levels can show a move of 100 points. As per time analysis next cycle from 29-03 July will be Volatile cycle with underlying trend neutral to bearish. Time Analysis of showing positive move after 14 June worked perfectly

Weekly Gunner

Gunner weekly charts bounced perfectly from red arc and horizontal line and resistance @grey line as shown in above chart.
Trading Monthly charts
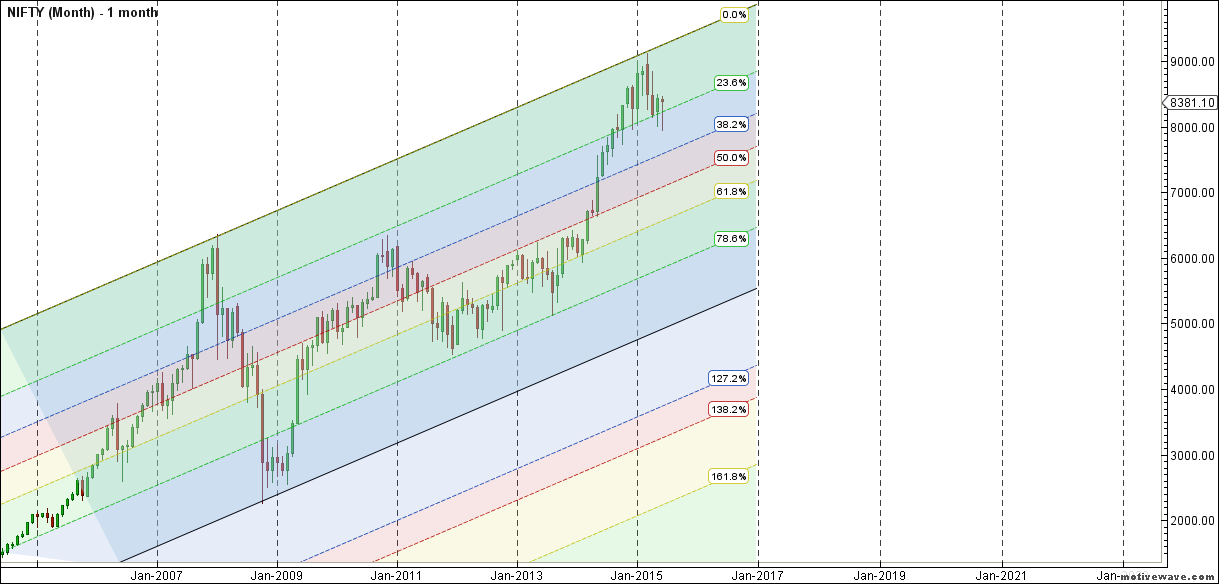
Monthly chart recovered back to its 23.6 % retracement.
Nifty PE
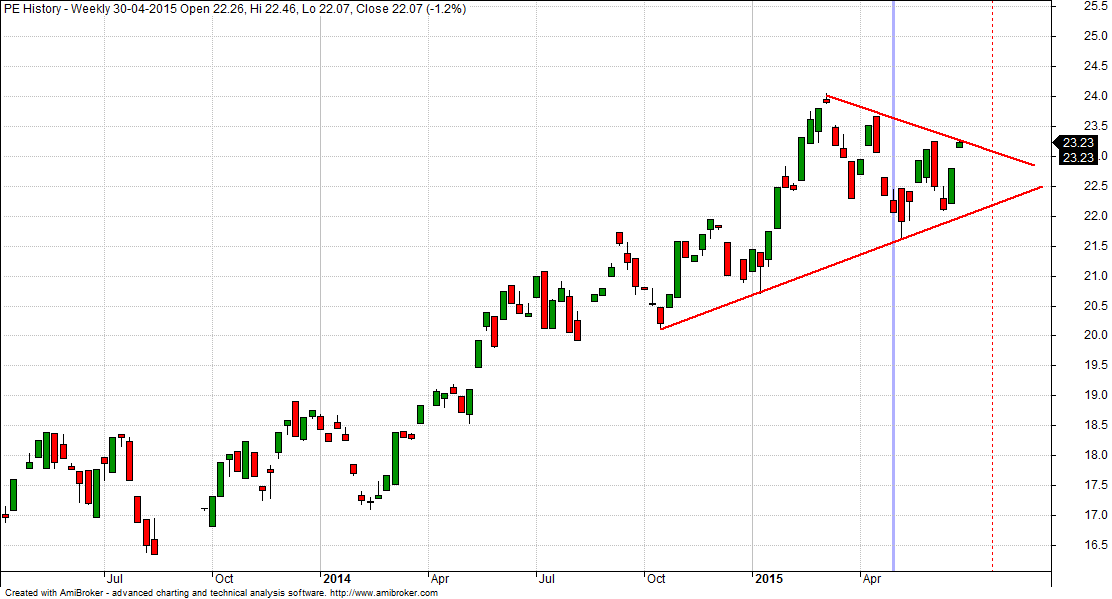
Nifty i s again in danger zone of PE charts also forming a traingle pattern, can come to down to rising trendline suggesting correction on cards,if pattern has to work.
Nifty Weekly Chopad Levels
Nifty Trend Deciding Level:8330
Nifty Resistance:8450,8519,8600
Nifty Support:8284,8200,8156
Levels mentioned are Nifty Spot
Let me go by Disclaimer these are my personal views and trade taken on these observation should be traded with strict Sl.Please also read the detailed Disclaimer mentioned in the Right side of Blog.
Want to see post in your Inbox,Register by adding your email id in Post in your Inbox section
Follow on Facebook during Market Hours: https://www.facebook.com/pages/Brameshs-Tech/140117182685863
This week as per time analysis is neutral to bearish and taking into consideration you were bang on in past , do you sense nifty will close below 8380 on Friday for your analysis to stand correct.
gm bramesh ji. kindly post BANK NIFTY’S PE CHART also . it will be a tremendous toll to us ..thanks
vge sir will try
Amazing analysis sir…keep it up…over all how do u see this month to pan out..? Closing to closing….negative or positive ?
Take 1 day at a time..
Is there any news in market for tomrw
Sirji according time analysis from 29june-3july market is neutreal to bearish. Is it between these dates or from the dates
From 29 June to 3 July is neutral to bearish ..
Nifty As per time analysis 22 June/25 June is Gann Turn date , except a impulsive around this dates. Last week we gave 29 June/02 Jly Nifty saw a volatile move .
29 June is yet to come – I think you accidently copy pasted it wrong.
Thanks its corrected.
Rgds,
Bramesh
nifty spot 8437.50 is 6/8 –pivot, reverse- major and now its looking down to — top of trading range –8281 — 5/8–as per murrey math time frame –(day) if not sustain at 8281 then 4/8 major support -ressistence is 8125 where nifty spot can rebound because it is also (8125) 61.8 off 8423.if sustain at 8125 then we can see a massive pull back upto 8750 before monsoon sessision .8750 is ultimate resisitence and 8/8 of mm.thank you.
Thanks for sharing analysis..
Rgds,
Bramesh
Good analysis sir. Please check Gann dates. Something is wrong