


Teaser : Provided the net purchase of 14.48% as on 05.03.15 is maintained by the FIIs, NIFTY must close March 15 at 9182.65.
It is a generally accepted and recognized theory that FIIs and DIIs can influence the NIFTY. In this article an attempt is made to understand the impact made by the institutional investors since April 2006 to Feb 2015.
Purchases and Sales data of FIIs and DIIs in the past eight years since 2007-2008 (2014-15 till Feb) is given below:Impact of institutional investment on NIFTY (FII & DII – NIFTY)
| FII: | ||||
| YEAR | PURCHASES | SALES | NET | % Net to Purchase |
| 2007-08 | 832965.45 | 870579.04 | -37613.59 | -4.52 |
| 2008-09 | 539697.6 | 612927.56 | -73229.96 | -13.57 |
| 2009-10 | 653801.39 | 614659.29 | 39142.1 | 5.99 |
| 2010-11 | 717070.56 | 669329.72 | 47740.84 | 6.66 |
| 2011-12 | 622412.76 | 601638.67 | 20774.09 | 3.34 |
| 2012-13 | 647964.77 | 547876.93 | 100087.84 | 15.45 |
| 2013-14 | 761039.9 | 686558.35 | 74481.55 | 9.79 |
| 2014-15 | 961100.66 | 903920.77 | 57179.89 | 5.95 |
| Total | 5736053.09 | 5507490.33 | 228562.76 | 3.98 |
| DII: | ||||
| YEAR | PURCHASES | SALES | NET | % Net to Purchase |
| 2007-08 | 311482.5 | 263757.59 | 47697.11 | 15.31 |
| 2008-09 | 247396 | 187355.53 | 60040.47 | 24.27 |
| 2009-10 | 342874.7 | 318814.64 | 24060.06 | 7.02 |
| 2010-11 | 319686.52 | 336081.93 | -16395.41 | -5.13 |
| 2011-12 | 271015.58 | 274801.85 | -3786.27 | -1.40 |
| 2012-13 | 234020.42 | 300956.85 | -66936.43 | -28.60 |
| 2013-14 | 271989.4 | 326061.37 | -54071.97 | -19.88 |
| 2014-15 | 357726.16 | 377184.51 | -19458.35 | -5.44 |
| Total | 2356191.28 | 2385014.27 | -28850.79 | -1.22 |
Birds eye inferences from the above table are :
- FII have remained “net purchasers” since 2009-10
- DII have remained “net sellers” since 2010-11
It would be interesting to compare the above data with how NIFTY has performed during the check period. Given below is the April (open) to Mar (close) values for the period.
| NIFTY | ||||
| YEAR | OPEN | CLOSE | GAIN/LOSS | % to Open |
| 2007-08 | 3740 | 4735 | 995 | 26.60 |
| 2008-09 | 4735 | 3021 | -1714 | -36.20 |
| 2009-10 | 3006 | 5249 | 2243 | 74.62 |
| 2010-11 | 5271 | 5834 | 563 | 10.68 |
| 2011-12 | 5835 | 5296 | -539 | -9.24 |
| 2012-13 | 5296 | 5683 | 387 | 7.31 |
| 2013-14 | 5697 | 6704 | 1007 | 17.68 |
| 2014-15 | 6729 | 8902 | 2173 | 32.29 |
If we read the above three tables together the inferences could be:
- FIIs were net sellers in 2007-08 but NIFTY rose up by 26.60%
- FIIs continued to be net sellers and NIFTY fell by 36.20 in 2008-09
- Since 2009-10 FIIs positive outlook in Indian market kept them net buyers
- NIFTY inspite of 2011-12 debacle has showed significant growth
- DIIs have remained net buyers for three years, 2007 -2010 and have turned net sellers since 2011 till date.
It is too early to draw a conclusion that FIIs influence NIFTY movement and DIIs don’t. Further statistical analysis of the data throws out more interesting facts.
It is time to recall our high school statistics lessons. Correlation coefficient is a way to determine how two variables are related. In addition to analyse whether variables are positively or inversely related, correlation also helps in understanding the degree to which the variables tend to move together.
I have taken net FIIs for 106 months activity (net buy/sell) as independent variable and net NIFTY movement as dependent variable. The coefficient of correlation computed is +0.66. Same analysis for 95 months of DII activity and NIFTY movement threw a correlation coefficient of -0.50. What does this mean ?
A correlation coefficient of .66 tells two important things:
- Because the correlation coefficient is a positive number, FII activity and NIFTY movement are postively related.
- Because .66 is relatively far from indicating no correlation, the strength of the correlation FII activity and NIFTY movement is strong.
Note : Correlation coefficient of 1 is perfect positive and -1 is perfect negative correlations.
DEFINITION OF ‘NEGATIVE CORRELATION’
A relationship between two variables in which one variable increases as the other decreases, and vice versa. In statistics, a perfect negative correlation is represented by the value -1.00, while a 0.00 indicates no correlation and a +1.00 indicates a perfect positive correlation. A perfect negative correlation means that the relationship that appears to exist between two variables is negative 100% of the time. It is also possible that two variables may be negatively correlated in some, but not all, cases. (Investopedia).
Negative correlation coefficient of -0.50 between DII activity and NIFTY movement is not expected and certainly surprising. It gives raise to suspicion that NIFTY goes down as DIIs buy and goes up if they sell.
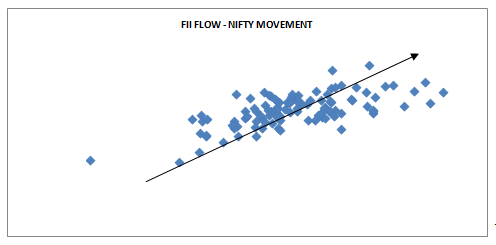
If we combine both FII and DII net buy/sell and NIFTY movement for 95 months we get a correlation coefficient of +0.69. This means the combined activity of both FII and DII viz a viz NIFTY is more positively co-related, than the individual FII – NIFTY relationship albeit marginally. This could be due to the ‘sponge’ effect (net activity of one off-set partially or fully by another like FIIs sell and DIIs buy during the month) or due to the fact that during the (excluded period for want of DII data) year Apr 06 to Mar 07 FIIs were net sellers to the tune of Rs 4523.44 and NIFTY moved up by 419 points. A scatter graph presentation of the test data appears as follows:


Basis for the above scatter chart is FII,DII and combined activity in X-Axis and NIFTY movement in Y-Axis. The chart format supports the computed correlation between the four i.e. FII, DII, Combined and NIFTY. Arrow (or trend line in our parlance) drawn across depicts the positive and inverse relationship between FII-NIFTY, Combined-NIFTY and DII-NIFTY.
Hence statistically proven correlation exists between NIFTY and FII & DII though in opposite directions. We will discuss further before drawing conclusions.
Given below are four tables categorizing FII, DII, Combined(2) movement and the resulting (if any) movement of NIFTY.
Table 1:
| FII NET-NIFTY MOVE | Total | % | Meaning |
| DOWN-DOWN | 30 | 28 | NET PURCHASE DOWN-NIFTY DOWN FROM PREVIOUS MONTH |
| DOWN-UP | 17 | 16 | NET PURCHASE DOWN-NIFTY UP FROM PREVIOUS MONTH |
| UP-DOWN | 12 | 11 | NET PURCHASE UP-NIFTY DOWN FROM PREVIOUS MONTH |
| UP-UP | 47 | 44 | NET PURCHASE UP-NIFTY UP FROM PREVIOUS MONTH |
| Total | 106 | ||
| Directly proportionate % | 73 | Influences Nifty to move up with net purchase and vice versa. |
Table 2:
| DII NET-NIFTY MOVE | Total | Meaning | |
| DOWN-DOWN | 12 | 13 | NET PURCHASE DOWN-NIFTY DOWN FROM PREVIOUS MONTH |
| DOWN-UP | 32 | 34 | NET PURCHASE DOWN-NIFTY UP FROM PREVIOUS MONTH |
| UP-DOWN | 28 | 29 | NET PURCHASE UP-NIFTY DOWN FROM PREVIOUS MONTH |
| UP-UP | 23 | 24 | NET PURCHASE UP-NIFTY UP FROM PREVIOUS MONTH |
| Total | 95 | ||
| Directly proportionate % | 37 | Influences Nifty to move up with net purchase and vice versa. |
Table 3:
| COMBINED NET-NIFTY MOVE-1 | Total | Meaning | |
| DOWN-DOWN | 27 | 28 | NET PURCHASE DOWN-NIFTY DOWN FROM PREVIOUS MONTH |
| DOWN-UP | 7 | 7 | NET PURCHASE DOWN-NIFTY UP FROM PREVIOUS MONTH |
| UP-DOWN | 13 | 14 | NET PURCHASE UP-NIFTY DOWN FROM PREVIOUS MONTH |
| UP-UP | 48 | 51 | NET PURCHASE UP-NIFTY UP FROM PREVIOUS MONTH |
| Grand Total | 95 | ||
| Directly proportionate % | 79 | Influences Nifty to move up with net purchase and vice versa. |
Table 4:
| COMBINED NET-NIFTY MOVE-2 | Total | % | Meaning |
| DOWN-DOWN-DOWN | 2 | 2 | BOTH FI & DI SELL – NIFTY GOES DOWN |
| DOWN-UP-DOWN | 26 | 27 | FI SELLS,DI BUYS – NIFTY GOES DOWN |
| DOWN-UP-UP | 13 | 14 | FI SELLS,DI BUYS – NIFTY GOES UP |
| UP-DOWN-DOWN | 10 | 11 | FI BUYS,DI SELLS – NIFTY GOES DOWN |
| UP-DOWN-UP | 32 | 34 | FI BUYS,DI SELLS – NIFTY GOES UP |
| UP-UP-DOWN | 2 | 2 | BOTH FI & DI BUY – NIFTY GOES DOWN |
| UP-UP-UP | 10 | 11 | BOTH FI & DI BUY – NIFTY GOES UP |
| Total | 95 | ||
| Directly proportionate % | 13 | i.e. Influences Nifty to move up with net purchase and vice versa. |
Above are simple pivot table of individual month’s net activity of FII, DII, Combined, Combined-independent and the month’s movement of NIFTY over its previous month. The results mean that:
Table 1: 73% of the time (month) FII net activity and NIFTY movement are in the same direction. Meaning, NIFTY went up when FIIs were net buyers and went down when they were net sellers.
Table 2: Claims that this synchronized movement happened only 37% of the time. Does it mean that for majority of the 95 months check period, NIFTY remained divorced from DIIs?
Table 3: When the individual net activity of FII and DII for the month is merged (net sales/purchases added together), it resulted in strengthening the uni-directional movement of Combined net activity and NIFTY.
Table 4:. Though primarily the table was drawn to see the effect of analyzing both institutional net activity month on month on NIFTY, it threw other derivatives that strengthens our common belief that FIIs impact NIFTY movement significantly more than the DIIs. Primary focus of combined net effect impact shows that only on 13% of the time all three were in union in their movement. But on 27% of times when FIIs sold and DIIs bought, NIFTY still went down. And on 34% of times, when FIIs bought and DIIs sold, NIFTY went UP. Inference could be, that out of the 95 month check period, on 61 months NIFTY moved along with FII when DII remained the opposing force.
Conclusions :
- The scope of the study can be enhanced by including total turn over (ie non institutional activity).
- There is no conclusive evidence that FIIs alone can influence market movement either side with their NET activity. NIFTY chose its own course that was diverse from FII activity for shorter periods. In due course either NIFTY or FIIs aligned with each others movement. (e.g. pre budget/current NIFTY negative movement and FIIs being net buyers. Same combination existed for different months during the study period).
- But, relatively strong positive correlation between NIFTY and FII net activity suggests that FIIs do have a significant influence on NIFTY movement. 0.66 correlation suggests not a perfect but a strong positive relationship between the two.
- Surprising negative correlation exits between NIFTY and net activity – but at mid path. (-0.50). Certainly not as strong as the positive correlation between FII – NIFTY.
- The positive and negative correlation between FII-NIFTY and DII-NIFTY can also be construed as :
- FIIs invariably buy into a raising market. They do not buy a consistent/longer period falling markets, though they may be short term buyers at perceived correction bottoms in a bull market.
- Over all positive correlation explains that NIFTY’s higher levels are used by FIIs to book profit – and it results in accelerating NIFTY’s down move.
- Above two statements taken together must be read as, FIIs buy at the lower end of the raising market and start exiting at relatively higher end of NIFTY’s raise.
- DIIs are focused on buying in a falling market. It can be the interpretation of the negative correlation between DII net activity, instead of saying NIFTY moves against the DII’s NET activity.
- May be due to their relatively value buying/bottom picking strategies and large accumulated carried forward holdings, DIIs enjoy profit booking in a raising market. Again DII’s net negative activity cannot be construed as Short creation in this present context, since we are studying data of cash segment of the market.
- Oh yes. The Teaser at the beginning. Well it is a teaser isn’t it ? Still the simple logic behind the calculations are:
- That NIFTY rose by an average of 50.42 points per month during the test period.(An average that smoothens out higher growth or fall during certain months).
- FIIs average NET purchase was 2.60% of their gross purchases month on month.(This average too digests months in which they remained NET sellers and months in which net purchases were as high as 10 to 30% of their gross purchases. Interestingly 30% seems to be the net purchases thresh hold).
- During the current month till date (i.e as on 05.03.15) FIIs have remained net buyers to the extent of 14.48% of their gross purchases.
- If 50.42 points can be gained by NIFTY with 2.60% of FII net buy, then what would be the number of points gained with a 14.48% net buy? Add the result to the NIFTY close of Feb 15. You will get TEASED.
Raider – you know that since the relationship between the two is only 0.66 and not 1, it need not be absolutely on dot. Again, FIIs must either remain net buyers at these levels or increase their net buy percentage to achieve/surpass this target. Still let us wait and watch.
Thank you for your time. I hope it is worth.
Acknowledgements :
- Money control.com and NSE site for FII/DII data.
- Just Nifty blog Sri Vanilango for the NIFTY data.
Written by Kindergardentrader
wonderful & informative analysis. you are really a good institution , a whole bunch of technical , advance technical & statistics
Excellent analysis- May be the stats analysis will be more revealing if we know how much of the purchases/sales are in Index stocks and how much in non-index stocks.
very interesting article sir.thanks a lot
regards
vikas kumar
new delhi
Thanks All !!
Thanks to Mr Rajgopal for writing such a nice article
Rgds,
Bramesh
Superb analysis Bramesh..
Very interesting analysis. It is definitely thought provoking. I tend to agree that the FIIs do come into the picture when they feel positively that the market is trending upwards. It also appears that they move out after a specified point. Corollary – it is not that they short with intention to pull market down.
I may not be entirely correct
Brameshji, any comment?
Regards
I think Bramesh is not a single person…he is becoming an institution… Kudos. I wish we moveout of paisa kamana mindset and understand market dynamics to complete a marathon in markets.
All Thanks & Rewards are too small in compare to above AWESOME EXCELLENT RESEARCH & ANALYSIS !
Dear sir. if you have time plz provide the same analysis for the bank nifty. thanks
Sir now u suggest that till march end 9182 nifty and weekly chart evening star pattern happened ???? then how it is possible…
Dear Vikas,
Its a “TEASER”. Please read the whole article, do not jump to conclusion just reading one line.
We do lot of research, so first read the whole thing than analyze than jump to any conclusion.
Rgds,
Bramesh
Great
Superb BRamesh ji!!! Would be great if you have included Client and Pro data……..I think Clients Data also play an important role.
good work sir …………….
exellant analysis bramesh ji.in addition to this if we add nifty PE we may see some more light on nifty.thank you ji
very thoughtful insights…thanks
Awesome analysis. Thanks a ton bro.
Thanks a lot for your valuable input