


HDIL

Holding 110 stock is heading back to 115/121.
Intraday Traders can use the below mentioned levels
Buy above 113.3 Tgt 114.4,115.9 and 117 SL 112
Sell below 111.5 Tgt 110.5,109 and 107.7 SL 112
Tata Motors
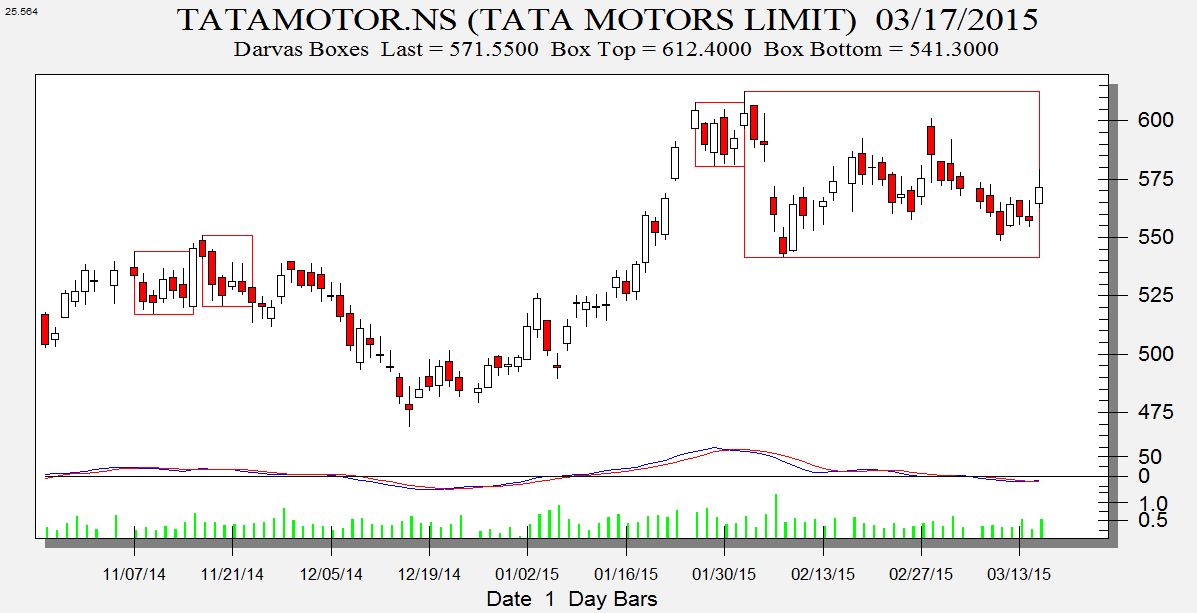
Any close above 576 stock is heading 589.
Intraday Traders can use the below mentioned levels
Buy above 573 Tgt 576,579 and 582 SL 571.5
Sell below 570 Tgt 565,563,560 SL 571.5
Colgate Pamolive

Intraday Traders can use the below mentioned levels
Buy above 2065 Tgt 2071,2085 and 2104 SL 2058
Sell below 2050 Tgt 2038,2030 and 2020 SL 2058
How to trade Intraday and Positional Stocks Analysis — Click on this link
Performance sheet for Intraday and Positional is updated for February Month, Intraday Profit of 2.81 Lakh and Positional Profit of 3.74 Lakh
http://tradingsystemperformance.blogspot.in/
http://stockpositionaltrading.blogspot.in/
- All prices relate to the NSE Spot/Cash Market
- Calls are based on the previous trading day’s price activity.
- Intraday call is valid for the next trading session only unless otherwise mentioned.
- Stop-loss levels are given so that there is a level below/above, which the market will tell us that the call has gone wrong. Stop-loss is an essential risk control mechanism; it should always be there.
- Book, at least, part profits when the prices reach their targets; if you continue to hold on to positions then use trailing stops to lock in your profits.
Follow on Facebook during Market Hours: https://www.facebook.com/pages/Brameshs-Tech/140117182685863
Please also read the detailed Disclaimer mentioned in the Right side of Blog.
The post given here are My Personal views and for learning purpose, trading or investing in stocks is a high risk activity. Any action you choose to take in the markets is totally your own responsibility. I will not be liable for any, direct or indirect, consequential or incidental damages or loss arising out of the use of this information.
Sir please have a look to EOD OI data, and please throw some light on 8700 strike of both CE & PE to understand it better. For me its confusing, If I apply above rules then my silly understanding says – both are booking profit.
http://www.nseindia.com/live_market/dynaContent/live_watch/option_chain/optionKeys.jsp?symbolCode=-10007&symbol=NIFTY&symbol=NIFTY&instrument=OPTIDX&date=-&segmentLink=17&segmentLink=17
Please read this
http://www.brameshtechanalysis.com/2013/09/volume-and-open-interest-analysis/
Thanks a lot, initially had thought how I missed this article but later checked dates and realize it was during my initial days I started following you. I remember your marriage around same time.
Once again thanks. After reading your article now I thing, if Price is rising and OI is also increasing and net change is negative is indicating ppl are buying but seller (specially earlier one) is now taking out their money. Please correct me if I am wrong.
In today’s case – I interpret that both bulls and bears have booked profit to some extend ahead of Feb outcome while new players have entered to market.
This scenario is quiet Possible.
Rgds,
Bramesh
Thank you sir for a quick reply, but I guess I didnt put my query in a correct way. I always apply above rules but get confused when data shows different picture, let me explain you what I want to ask, my query is about OI, mean how to know OI is increasing or decreasing
Here’s data for 8700CE Strike
OI…………………Chang in OI……Net Change%
3,095,450………384,475………..-18.25
As of my simple understanding
1. If change in OI is positive and Net % is also positive – its increasing
2. If Change in OI is negative and net % is also negative – its decreasing
But what iff
1. Change in OI is positive and net change % is negative
2. Change is OI is decreasing and net change % is positive
Many times I saw it whenever I go to check OI status of a strike. As you can check above data change in OI is positive meaning 384,475 contracts were added to strike but unable to understand why its -18.25% why its not in positive.
Thanks again for your help.
Hello Sir, I am a silent follower of your since past 2 year. I have one query, please help me in understanding – if OI of a strike is increasing and Net Change % is decreasing then how to interpret it. Here is data for 8700CE I copied from NSE, its always confusing.
For 8700 CE
OI Chng in OI Volume IV LTP Net Chng Bid Qt Bid Pr Ask Pr Ask Qty
2,862,150 151,175 301,804 18.27 99.20 -7.05 25 99.20 99.60 125
BULLISH
Price rise along with OI rise(New bull positions)
Price rise with OI decrease(Longs Booking Profit)
BEARISH
Price down with OI down(Bear Profit Booking)
Price down with OI rising(Bearish positions added or weak
hands unable to exit, stuck with positions)