How Bulls markets are made?
India has first major Bull market when Sensex moved from 400 in 1989 to 4546 in April 1992 a Rally of almost 1100% in matter of 3 years which will be remembered for Liberalization and reforms by Manmohan Singh . After that we got the Harsh Mehta scam where Sensex tumbled from all time high of 4546 to 1980 low made in Apr 1993. Next Major Bull market was seen from 2003 to 2008 where Sensex Rallied from 2900 to 21K and Nifty from 1000 to 6333 a run of almost 700 %.
From the highs of 1992 till 2003 Sensex did not did anything trading in the wide range in between we got the Asian Market crisis, Dot com bubble but overall Sensex remains in the range than the Big breakout came in 2003 and Sensex and Nifty saw a 7 fold rally till 2008.
So as per above analysis multi year Bull runs which we saw in 1989-1992 and 2003-2008 are always followed by mutil year of consolidation (1992-2003 and 2208-2014)where we see time and price correction.As shown in below chart Consolidation (1992-2003 )and Breakout and now again we saw a consolidation (2008-2014) and breakout.
So Nifty/Sensex after 6 years of Consolidation saw a breakout in April 2014 , So how many legs the current bull run have, We have RJ giving target of 1.3 Lakh on Nifty by 2030 but I will try to analyze whats in store for us in next 2 years which will help both traders and investors.
Yearly

Weekly
As per Weekly Chart the range of 7300-7400 will provide strong support to Nifty if and when it comes as Nifty made strong base in the range also 55 WEMA lies in that range. SO dips in this range as and when it comes should be bought by investor.

Monthly
Between 2008 and 2014, the Nifty re-tested the 2008 high on two occasions in 2010 and 2013.Both these attempts lacked broader market participation as Mid caps and Small caps saw big underperformance during these period. But after the thumbing madate we got in May 2014 saw mid caps outperforming which shows participation on all ends.
Monthly chart is showing a clear ascending triangle formation with breakout above 6335/21206 for Nifty and Sensex. So target as per ascending triangle comes
6335+(6335-2252) =10418
21206+(21206 – 7697) = 34715
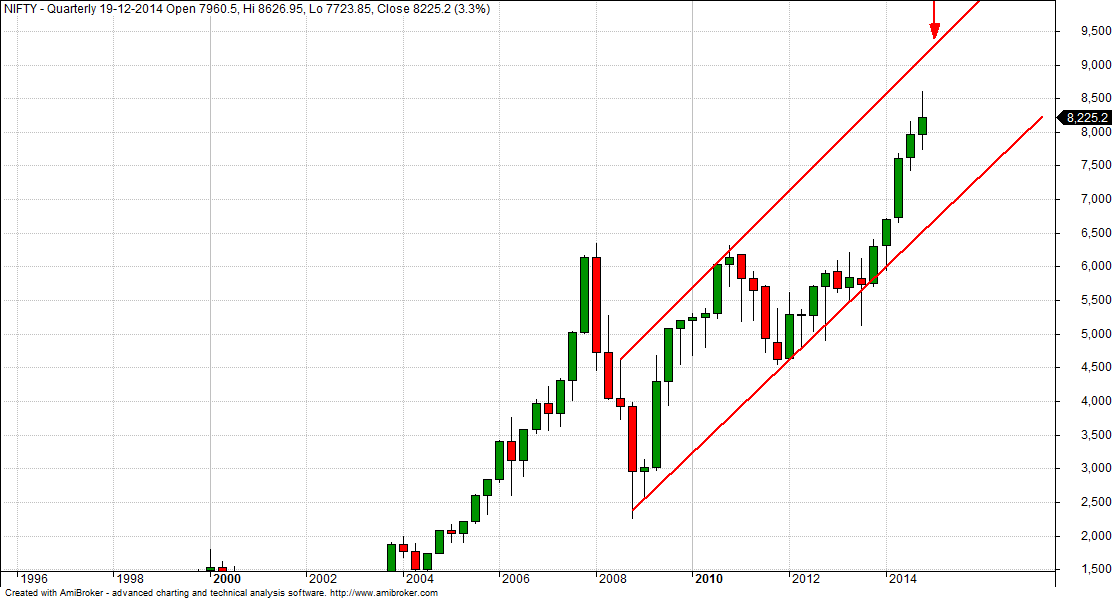
Quaterly
Quarterly chart also shown trendline resistance coming in range of 10000/10500.
So on large time frame looks like we are still ready for more returns and traders/investor should use all dips if and when they come to buy quality stocks.
Please understand this is long term view you will not see a straight line rise there will be many ups and down.In 2003-2008 Bull run we had 30% correction in May 2006 and 16% in 2007 .
To end my analysis always remember the below line


very enlightening article, thanks Bramesh ji….
Any time frame for 10,000-plus – end of this year, end of next quarter?
Clear view.thx
How much it can correct before reaching 11000 ?Is recent bottom @ 7961 is Short term bottom or Long term one.If ST how much it may go up as ST top?
Please understand this is long term view you will not see a straight line rise there will be many ups and down.
Rgds,
Bramesh
Tanks a lot to clarify so quickly
” Monthly chart is showing a clear ascending triangle formation with breakout above 6635. So target as per ascending triangle comes
6635+(6335-2252) =11018 ”
Sir there seems to be an error in the above equation
6635+(6335-2252=4083) = 10718 or
6635+(6635-2252=4383) = 11018
Kindly correct the same.
Regards
Thanks sir for the great analysis.
great work. keep it up. Always love to read your unique posts. Thanks
How to identify Quality Stocks Coz on news chaneel experts , its changing daily. Do u have any suggestion?
Best way to find quality stocks is try to buy stocks of those companies which you use in your daily life. Like HUL,ITC, TVS Motors
Super sir
Sir, great analysis indeed
How much it can correct before reaching 11000 ? or already made bottom @ 7961
great post sir!!
Thx for your superb analysis. Keep up the good work. Thx again. Ravi
Excellent Explanation of BULL RUN.
Really good analysis….
excellent,,, my view on nifty is 10400 .but whether it will happen in a single journey or after correction ?will u clear ?
Excellent Analysis. Thanks
Lovely analysis. Loved the use of different timframe charts.