


Last week we gave Nifty Chopad level of 8026 and Nifty did 3 target of upside rewarding chopad followers by 179 points and in process making new life highs. Next week is Holiday shortened week as 4 Nov and 6 Nov are trading holiday and NSE doing disaster recovery so live data feed will not be avilable to most of traders. We were able to catch the bottom of Nifty as per Nifty signal bottom formation, FII FnO Data Analysis Lets analyze how to trade in expiry week.
Nifty Hourly Chart
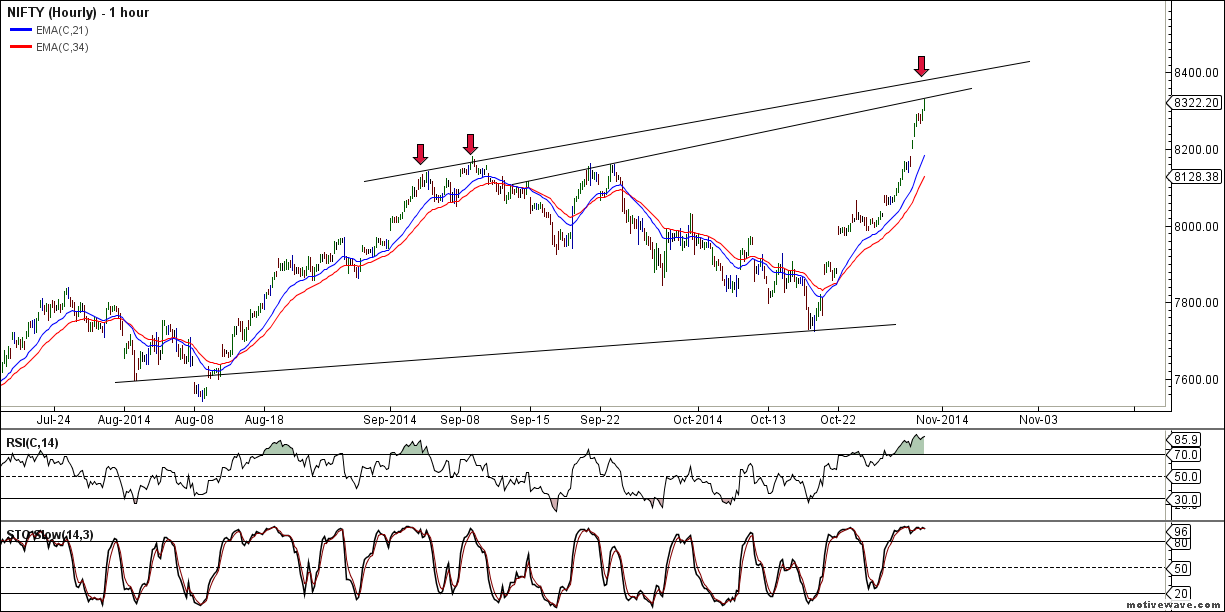
Nifty Hourly charts has been on tear and rising like a phoenix with out signifcant correction,Maximum correction seen on hourly charts is 26 points, if any correction is more than 26 points signify we can see pause in current trend and see profit booking also, Strong support now exists at 8200 and time correction will be seen next week.
Nifty Hourly Elliot Wave Chart
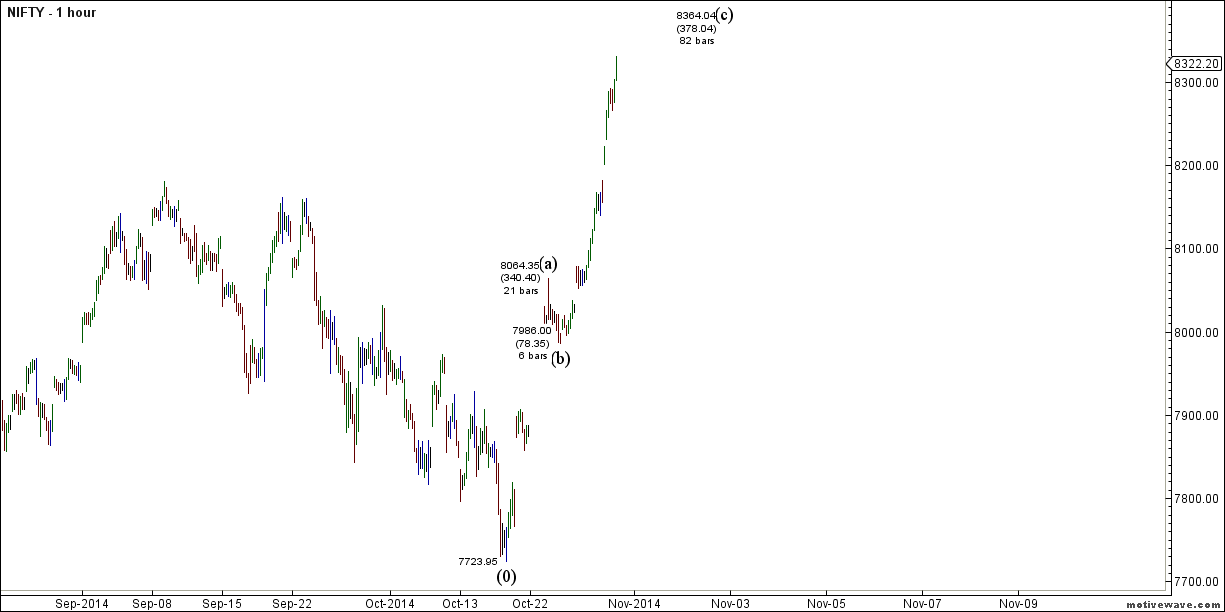
Hourly EW is shown and 8355/8364 needs to be seen very closely unable to close over can see correction till 8300/8266.
Nifty Daily Chart
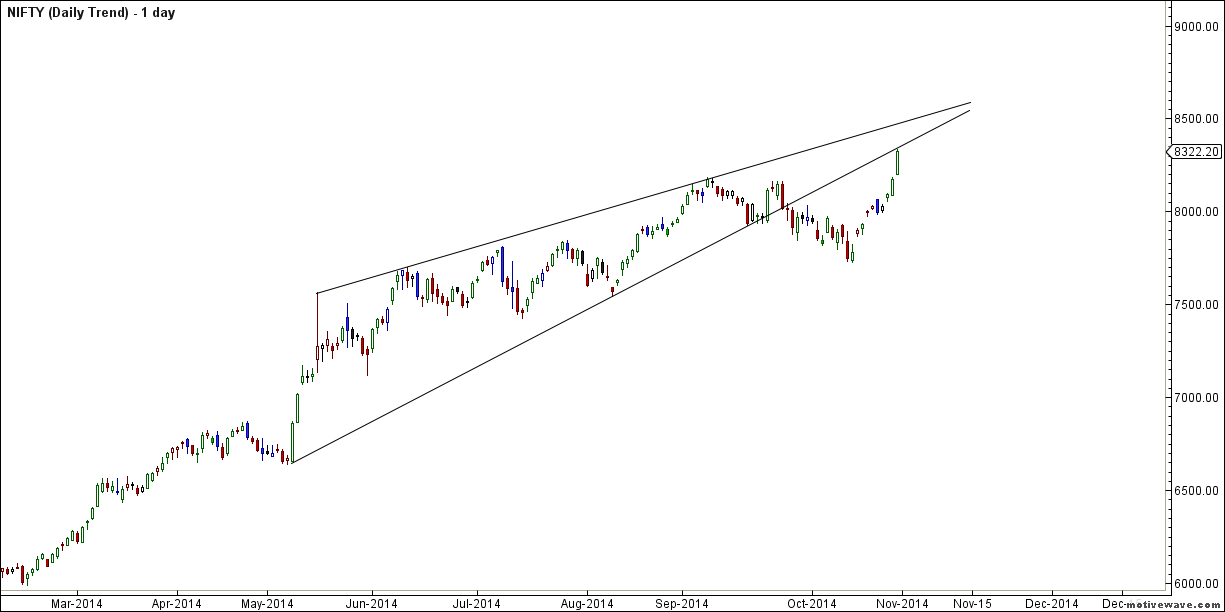
Nifty daily chart is also entering confluences of trendline zone,8355 will play an important resistance strong support @ 8200.
Nifty Harmonic
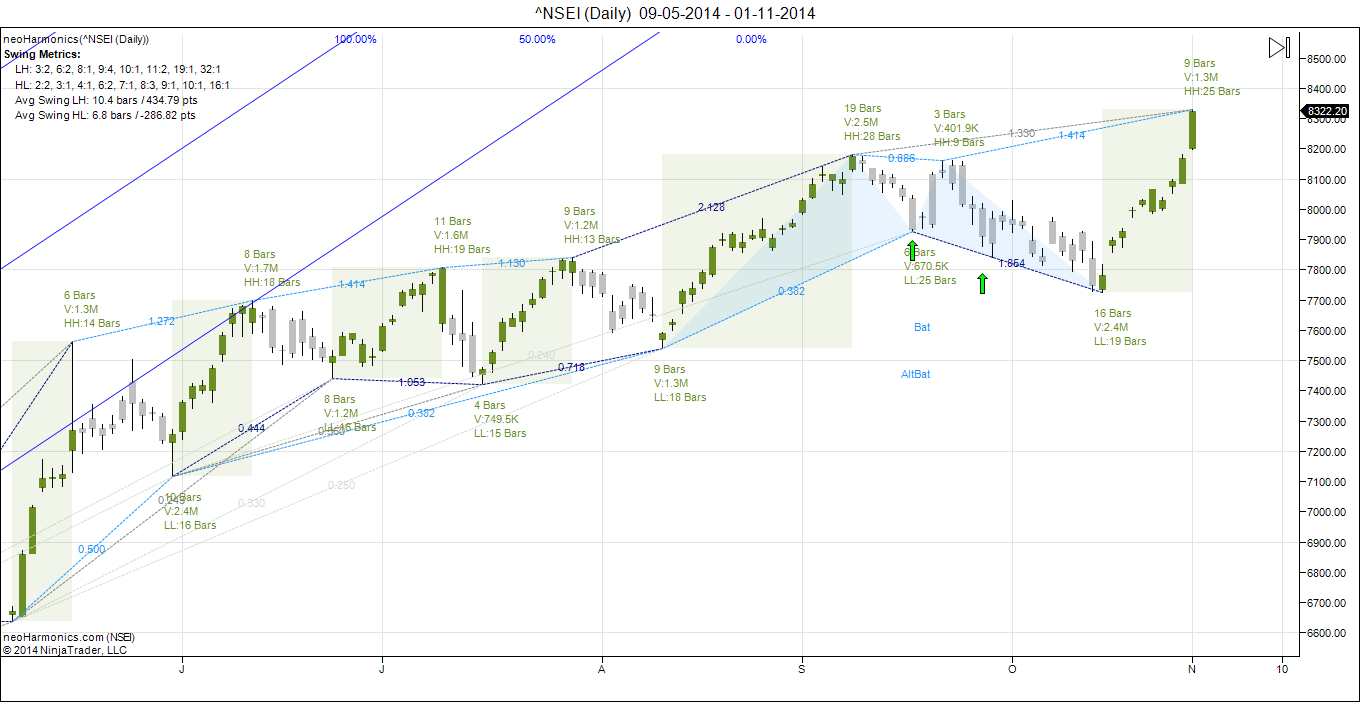
Nifty as per harmonic pattern seems to have covered maximum move of this current rise, We see maximum rise of 650 in upmove we have done 604 points in 10 trading session so upmove will come to an end, Also as show in above chart Nifty has reached the top end of grey box upside is limited we can see decline of 200/300 points in nifty by 20 November.
Nifty Daily Elliot Wave Chart
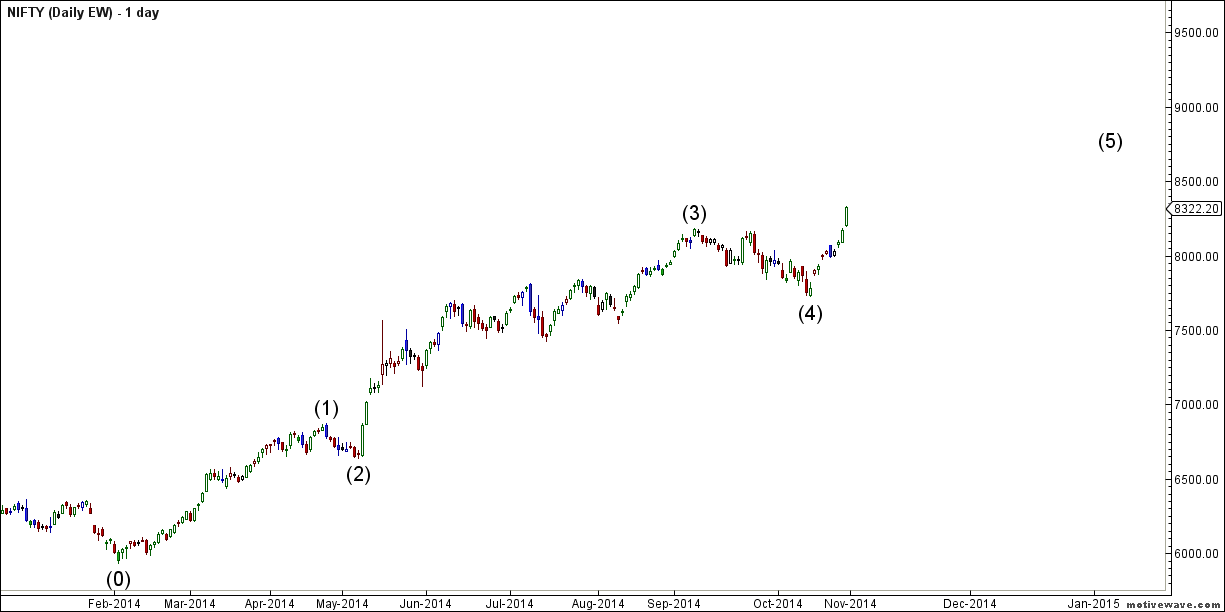
Daily chart are is showing 4 wave completed @7723 and V wave has started target comes @ 8660.
Nifty Gann Date
As per time analysis 06 November is Gann Turn date , except a impulsive around this date. Last week we gave 29 October is Gann Turn date and Nifty was up by 80 points on that day.
Nifty Gaps
For Nifty traders who follow gap trading there are 7 trade gaps in the range of 7000-7800
- 7067-7014
- 7130-7121
- 7276-7293
- 7229-7239
- 7454-7459
- 7526-7532
- 7598-7568
- 7625-7654
- 7780-7856
- 7927-7974
- 8027-8052
- 8169-8198
Fibonacci technique
Fibonacci fan
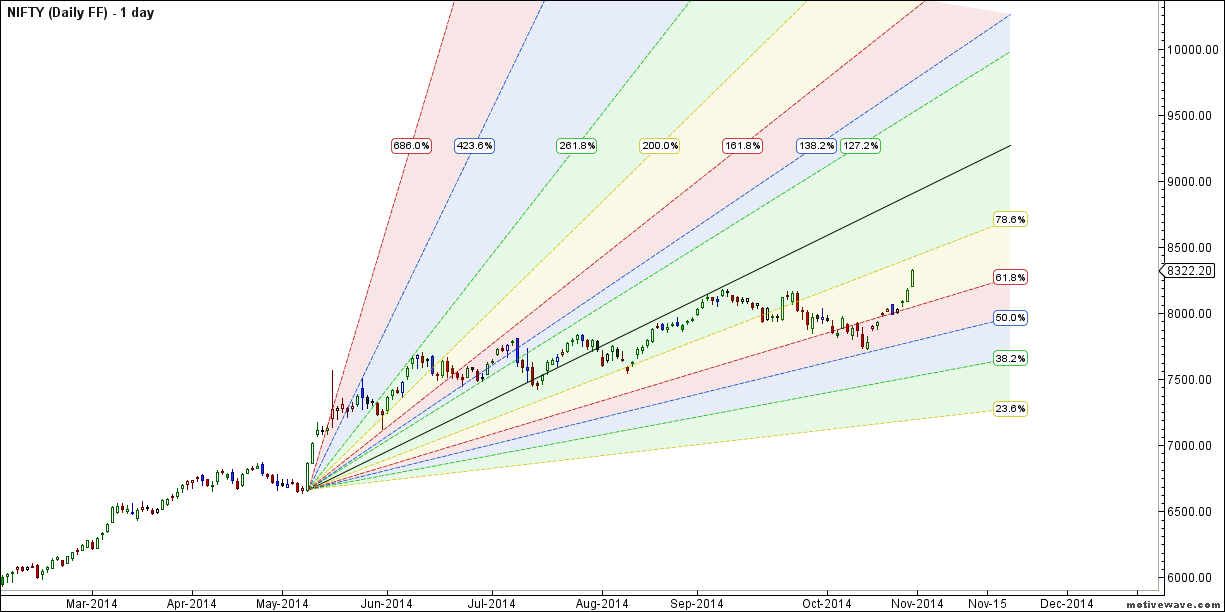
As per gann fan 8355 is coming up as resistance .
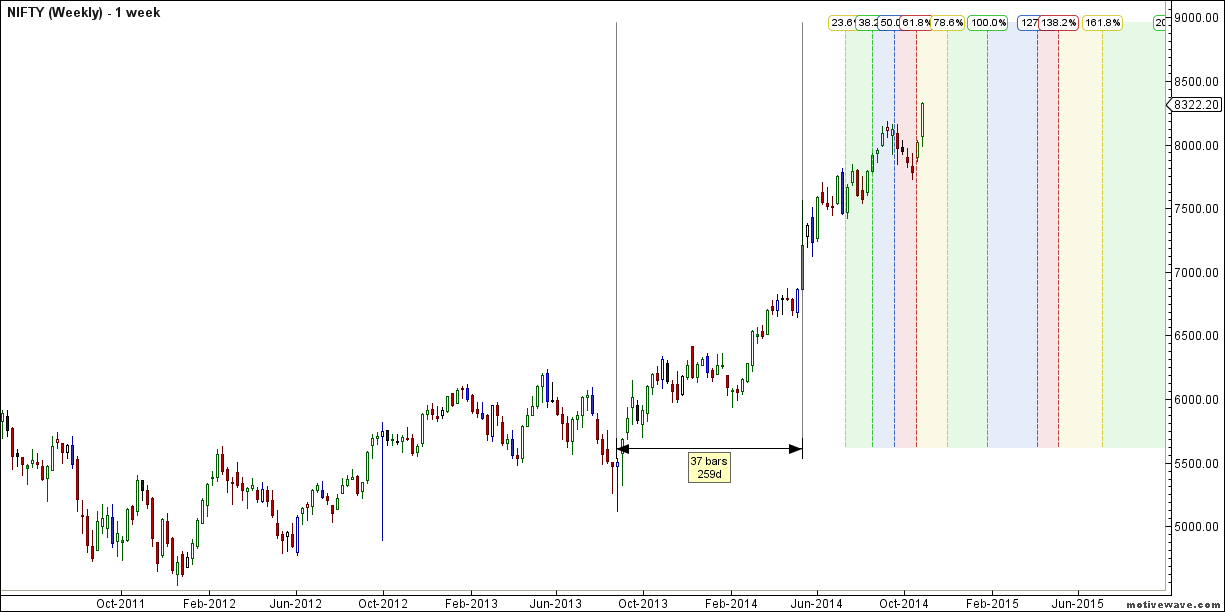
Nifty Weekly Chart
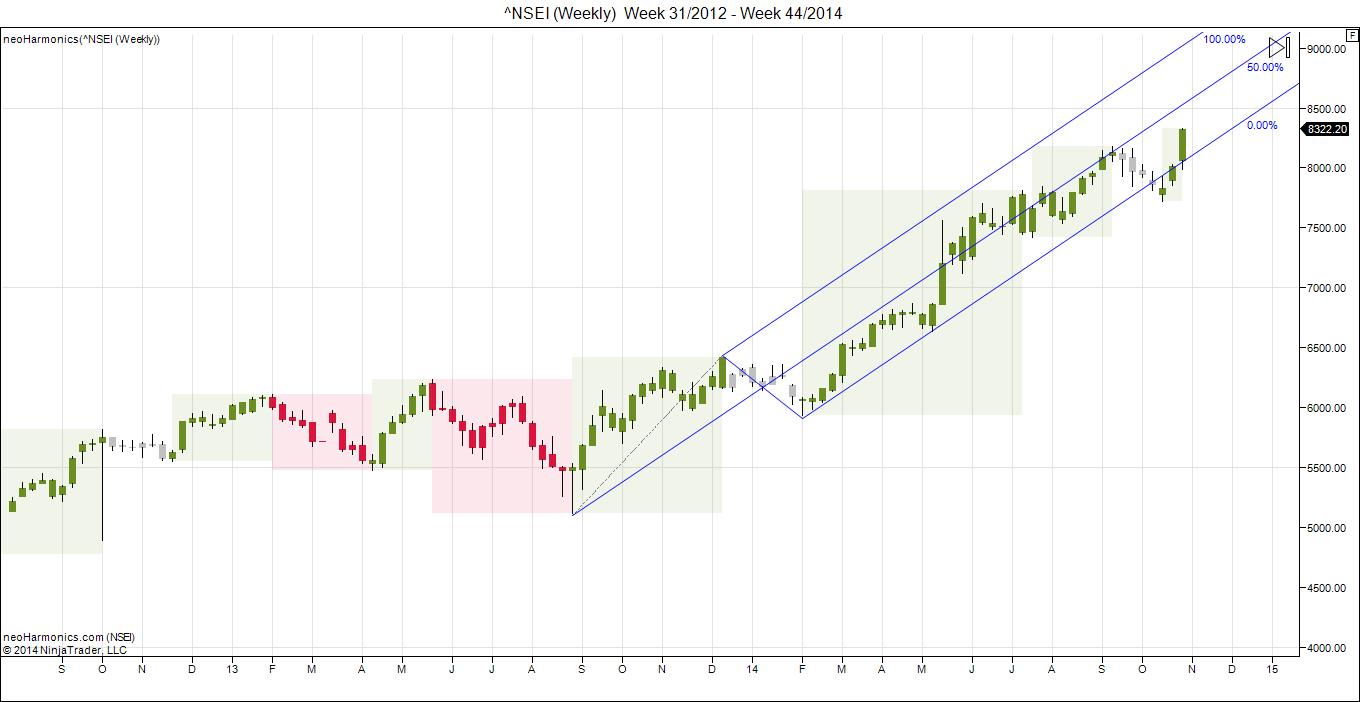
It was positive week, with the Nifty up by 307 points closing @8322. As per Harmonic Weekly chart nifty has reached the grey box upper end on weekly chart also so time to be cautious as we can see sideways move with a negative bias in coming 2 weeks.
Trading Monthly charts
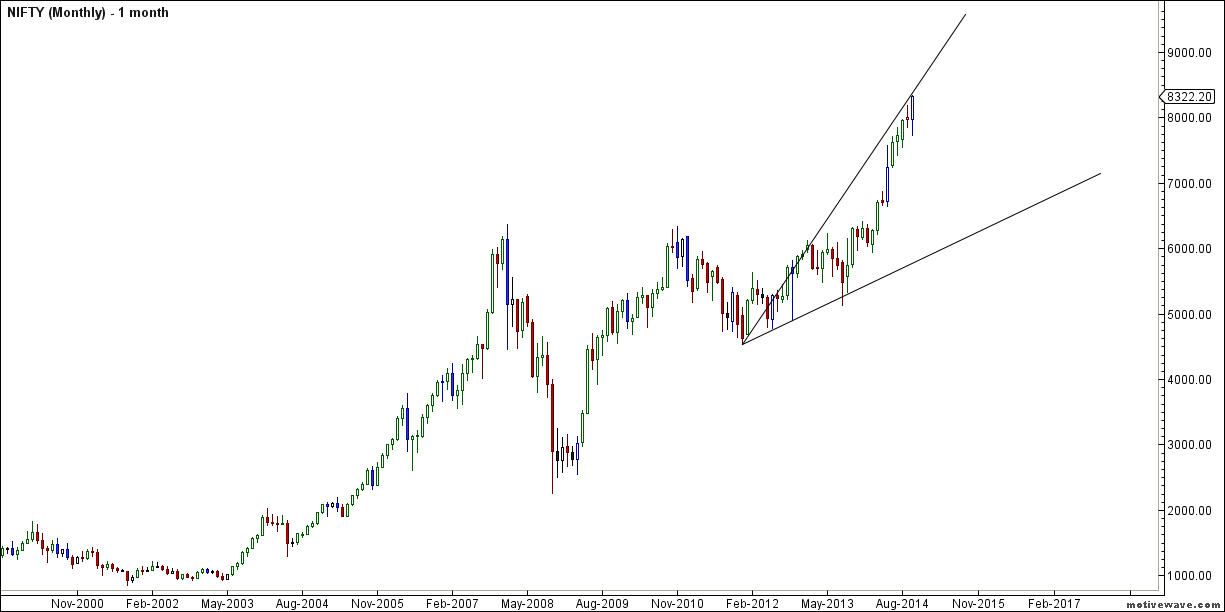
Bulls need to protect the recent low of 7723 for rest of days for bullish moves to continue.
Nifty Weekly Chopad Levels
Nifty Trend Deciding Level:8355
Nifty Resistance:8416,8465,8550
Nifty Support:8286,8212,8170
Levels mentioned are Nifty Spot
Let me go by Disclaimer these are my personal views and trade taken on these observation should be traded with strict Sl
Want to see post in your Inbox,Register by adding your email id in Post in your Inbox section
Follow on Facebook during Market Hours: https://www.facebook.com/pages/Brameshs-Tech/140117182685863
Wave 4 on daily chart was not able to tie with any Fib ratio.Do you still think its valid?
Yes its pretty much valid. I do not use text book based EW, I have my own rules
Rgds,
Bramesh
also since start of this bull run nifty has been rising for about 10 days before going in sideways/corrective phase. today is 10th day as well of this upmove from 7730
Very Nice..
Rgds,
Bramesh
Thanks for updating sir
Dear Sir, will you give daily TC levels also for nifty
Thank you sir…
o5th or 07th for the Gann date
as a beginner of EW am i right by saying we have completed 4(4) and going towards 4(5) …pls clarify if i’m wrong and if possible can u map the waves i.e from wave 1 onwards as i’m a bit confused reading it….Thank U
Sir, BANK NIFTY analaysis….Waiting for it…
Hi Brameshji,
is the gann date alligned alternatively as up & dn?
yes vijayji
Rgds,
Bramesh