


Last week we gave Nifty Chopad level of 7990 and Nifty did a low of 7923 on downside almost achieving the 1 target is Holiday shortened week.Next week traders need to Watch For Fed Minutes which will come Wednesday night ,Brazil Election and Bank of England decision will impact the market. Lets see how to trade market next week. Nifty trading will start on Tuesday as Monday is again a trading holiday.
Nifty Hourly Chart
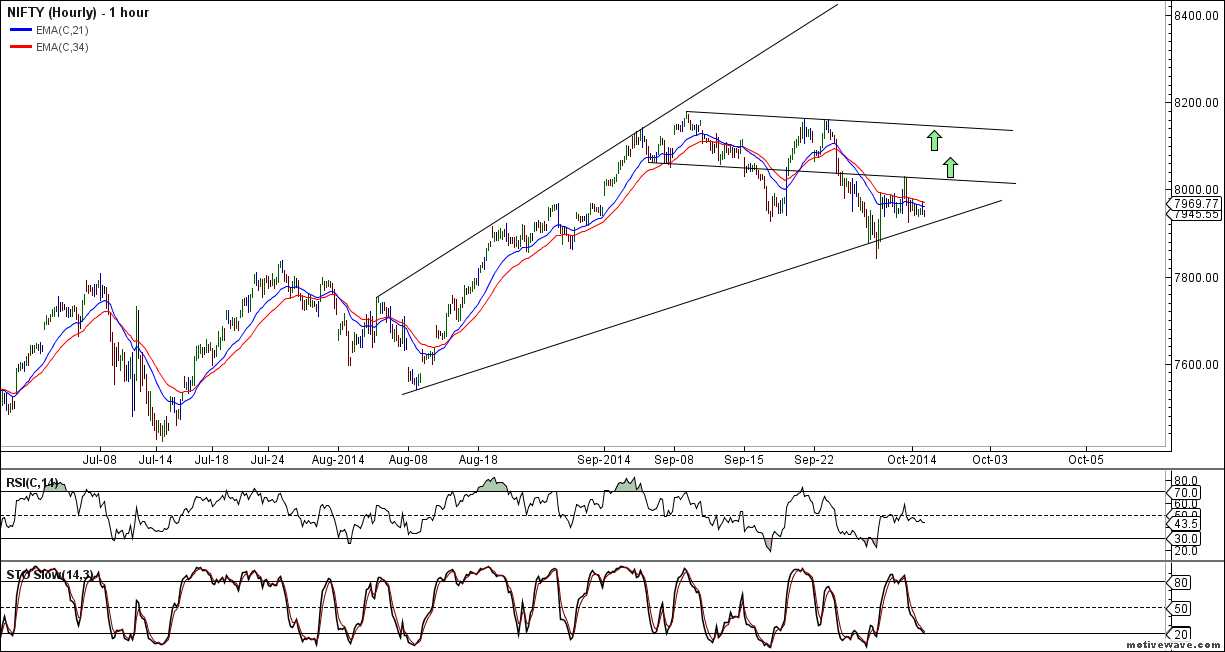
Nifty Hourly charts 21/34 EMA have gone flat, trendline support exists @ 7900/7914 range, Bulls will get active above 8030 for initial target of 8100 and 8175.
Nifty Hourly Elliot Wave Chart

Hourly EW is showing correction can be seen till 7914 range and bounceback to 7986 range.
Nifty Price Channel
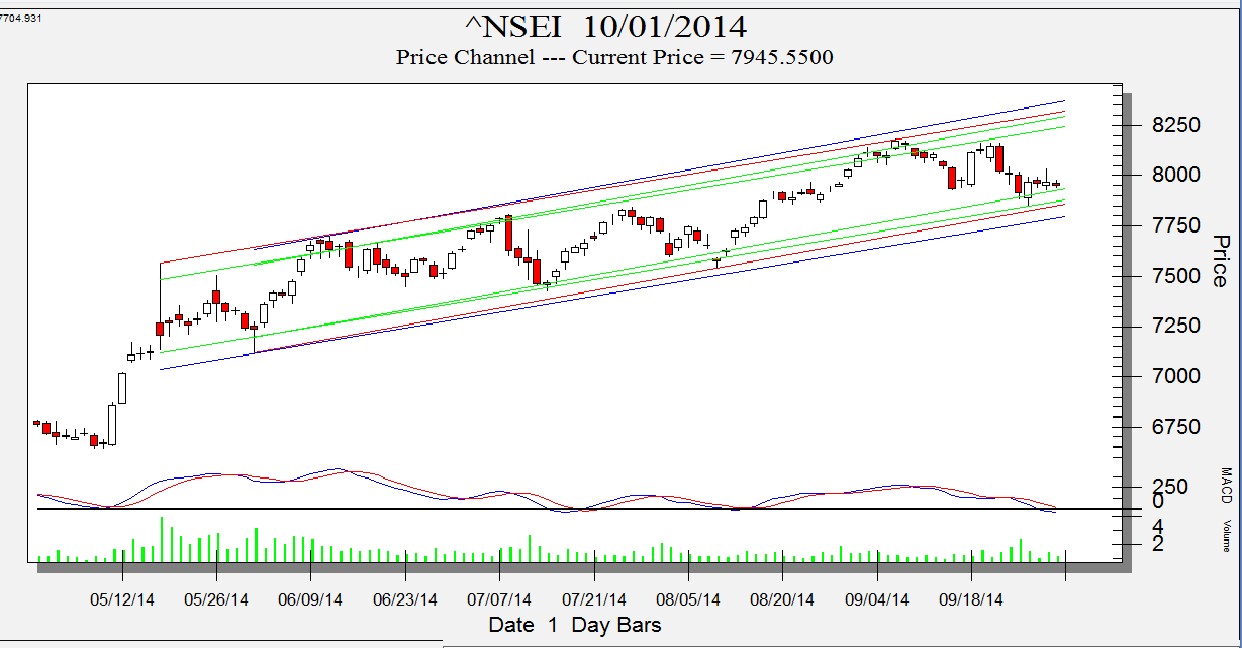
As per Price Channel concept Nifty is entering in zone of demand as seen in above chart holding the same upmove can be seen towards the highs of channel.
Nifty Daily Chart
Nifty daily chart bias is still in neutral zone so expect some range bound volatile move in nifty in coming week.
Nifty Daily Elliot Wave Chart

Daily chart are is showing 4 wave completion around 7841 and bounceback can be seen as part of 5 wave till 8150/8200 in next 2 week.
Nifty Gann Date
As per time analysis 07 October is Gann Turn date , except a impulsive around this date.
Nifty Gaps

For Nifty traders who follow gap trading there are 7 trade gaps in the range of 7000-7800
- 7067-7014
- 7130-7121
- 7276-7293
- 7229-7239
- 7454-7459
- 7526-7532
- 7598-7568
- 7625-7654
Fibonacci technique
Fibonacci fan
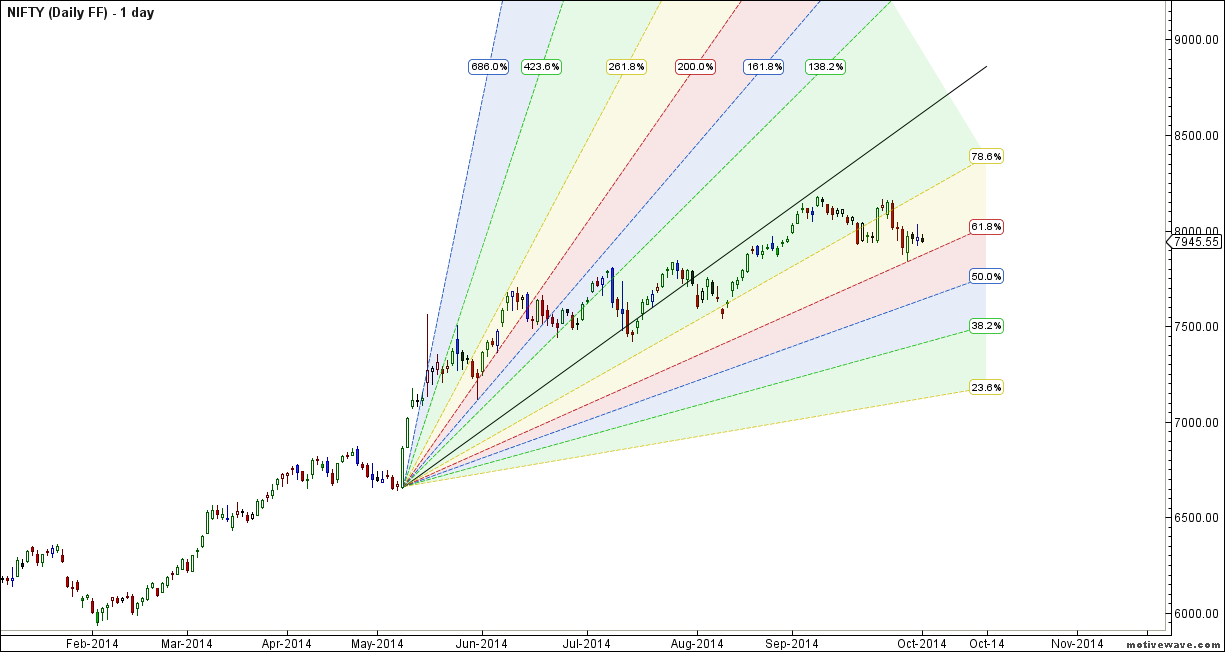
7841-7850 needs to be closely watched as per gann fan support.Resistance @ 8130.
Nifty Fibonacci Retracement

8041/8088 are 2 Fibo retracement levels which needs to be watched closely in coming week.
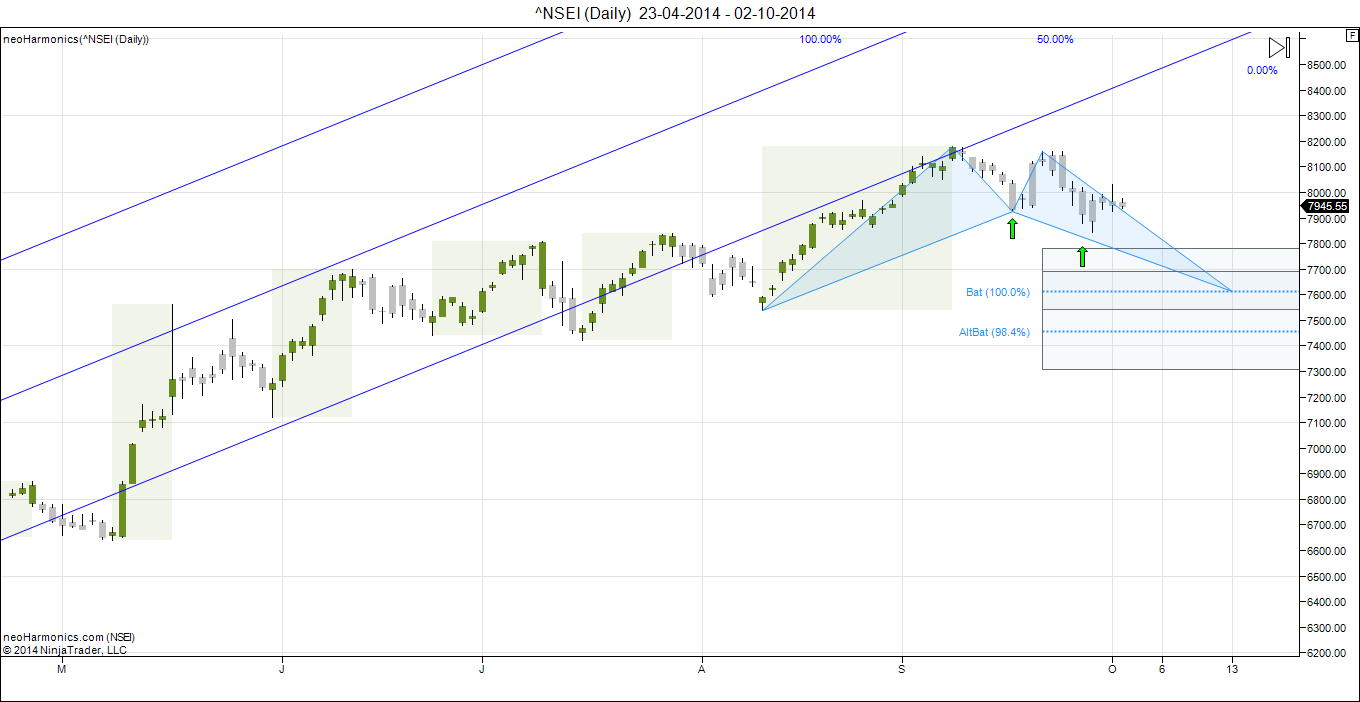
Nifty Weekly Chart
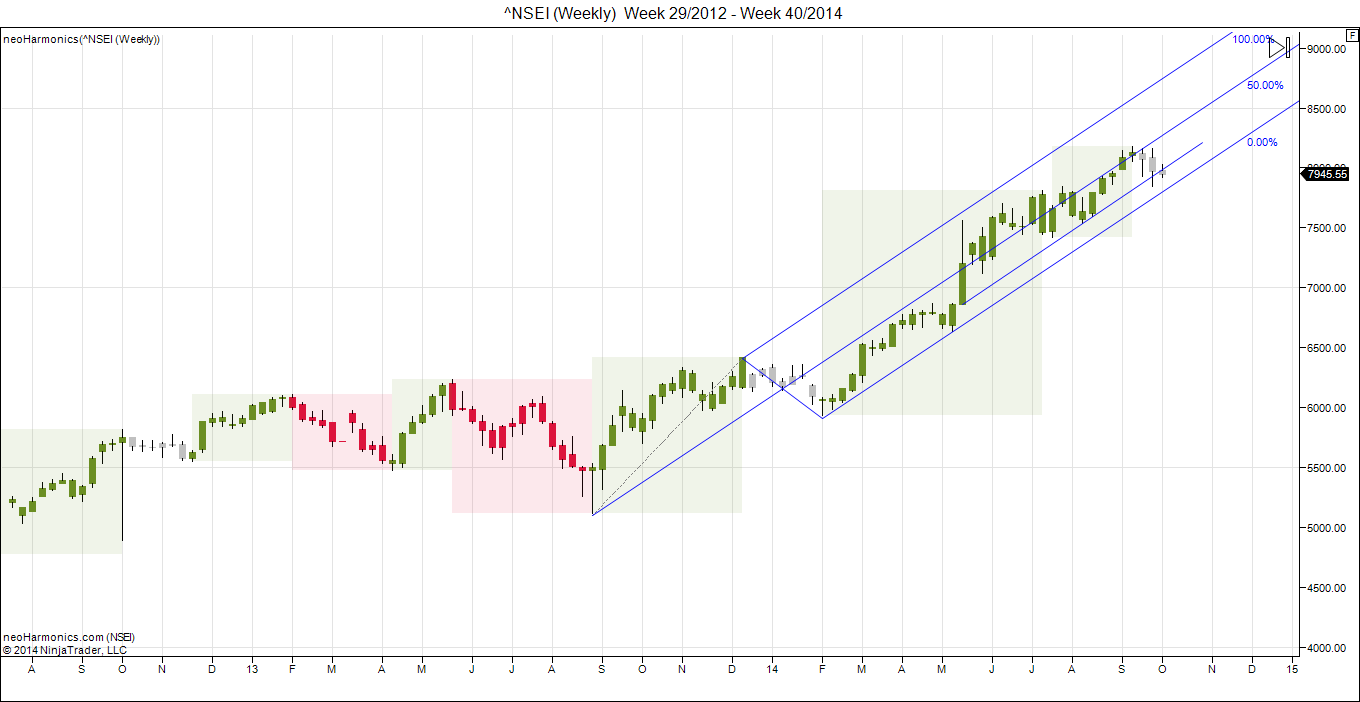
It was negative week, with the Nifty down by 23 points closing @7945. As per Harmonic Bias as seen in above chart, first time after 6000 and 31 week we are seeing trend change from Bullish to Neutral, so expect choppy/sideways move till the Harmonic Bias turn back to Bullish zone ie, Weekly candle turns back to green.Nifty took exact resistance near Andrew Pitchfork resistance line and now need to see pullback we saw has formed short term bottom before next round of upmove.Also we are approaching the 55 day cycle on Weekly charts also.Weekly time analysis suggests next cycle which is mostly to be sideways/negative might last another week.

Trading Monthly charts
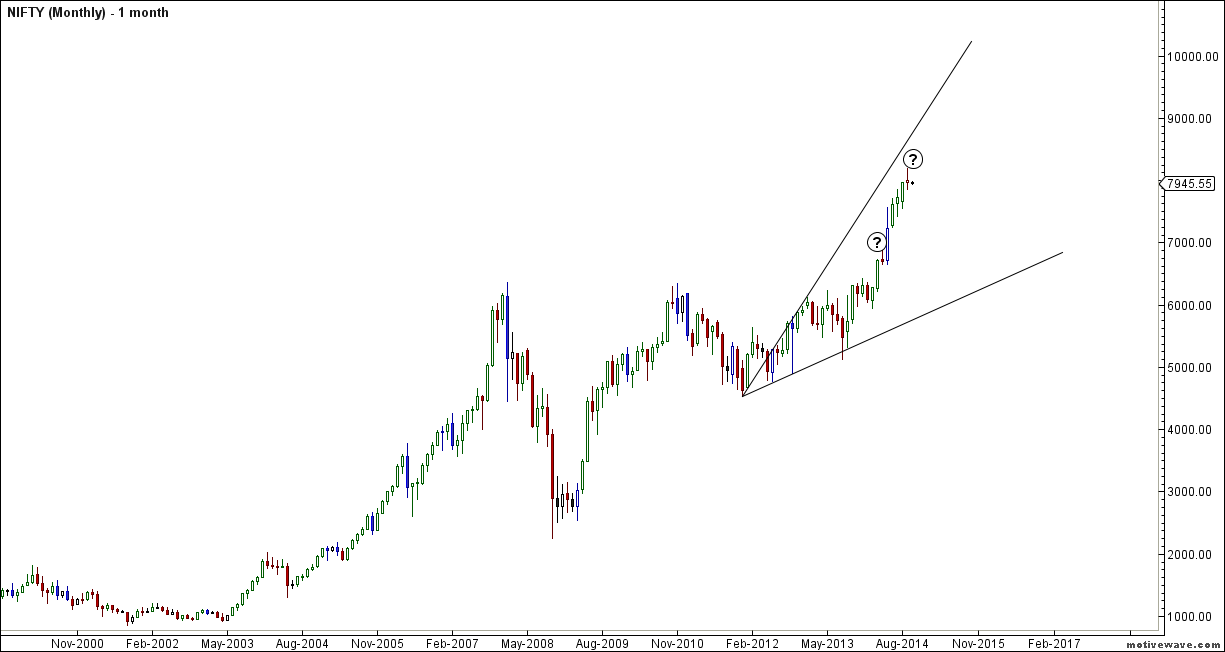
Bulls saved 7950 on Monthly levels, also forming a spinning top pattern, Now as seen in above chart this month we can see a good upmove going by Historical pattern of this bull run.
Nifty Weekly Chopad Levels
Nifty Trend Deciding Level:7966
Nifty Resistance:8030,8073,8160
Nifty Support:7900,7841 ,7783
Levels mentioned are Nifty Spot
Let me go by Disclaimer these are my personal views and trade taken on these observation should be traded with strict Sl
Want to see post in your Inbox,Register by adding your email id in Post in your Inbox section
Follow on Facebook during Market Hours: https://www.facebook.com/pages/Brameshs-Tech/140117182685863
thanks sir , to suggest for future planning to trade in nifty and other script
thanks again for free help to new weak traders