


Last Week we gave Chopad level of 7766, Nifty did all 4 target on downside rewarding trend follower with 300 points. Using the Golden Ratio we were able to predict the Top of Nifty around 7800 Can Nifty form short term top around 7800 ? Nifty saw a decline of 3.8% last week panicking traders and investor and many of them talking bull run is over , So Lets analyze how to trade Nifty in next week.
Nifty Hourly Chart

Hourly charts shows strong support in range of 7380-7400. Holding the same we can see a bounceback till 7600 odd levels.
Nifty Elliot Wave Analysis

As per Elliot wave Theory C wave on hourly charts can get over near 7419 levels and bounceback till 7600 odd levels.
Nifty Daily Chart

Nifty is near its 50 DMA which provides good support in bull market holding the same 20 DMA becomes target.
Nifty Daily Elliot Wave Chart

Daily chart are still trading in 4 Wave @ 7394 if it indeed get over we enter in 5 wave where target is huge as shown in above chart.
Nifty Gann Date

17 July +/1 days is gann turn date and explosive move is round the corner. Last week we gave date of 11 July +-1 date and we saw explosive downmove on 11 July.
Nifty Gaps
For Nifty traders who follow gap trading there are 7 trade gaps in the range of 5300-6400
- 7067-7014
- 7130-7121
- 7276-7293
- 7229-7239
Fibonacci technique
Fibonacci fan

As per Gann Fans Nifty has taken support at gann trendline holding the same will be bullish for initial target of 7600.On Downside strong support in range of 7385-7400 if broken can see downside till 7200 as shown in above chart.
Nifty Fibo Retracement

7361 and 7223 which are 38.2% and 50 % retracement should be watched closely in coming week.
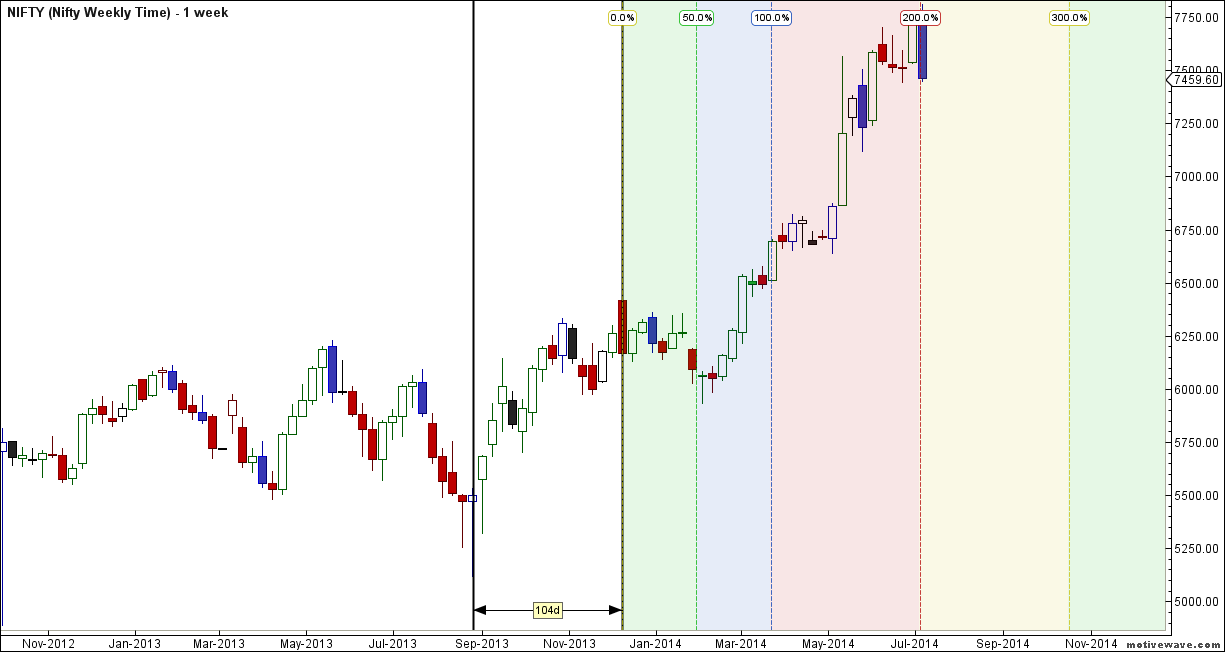
Nifty Weekly Chart

It was negative week, with the Nifty up by 292 points closing @7460.Weekly charts are also showing strong support in range of 7400-7380 use these level to exit shorts. This is what we mentioned last week, Now Nifty is its Andrew Pitchfork median line and unable to cross the same pullback can start, Also nifty will be entering a new quadrant from next week as per time analysis and need to be extreme cautious on longs now.
Trading Monthly charts
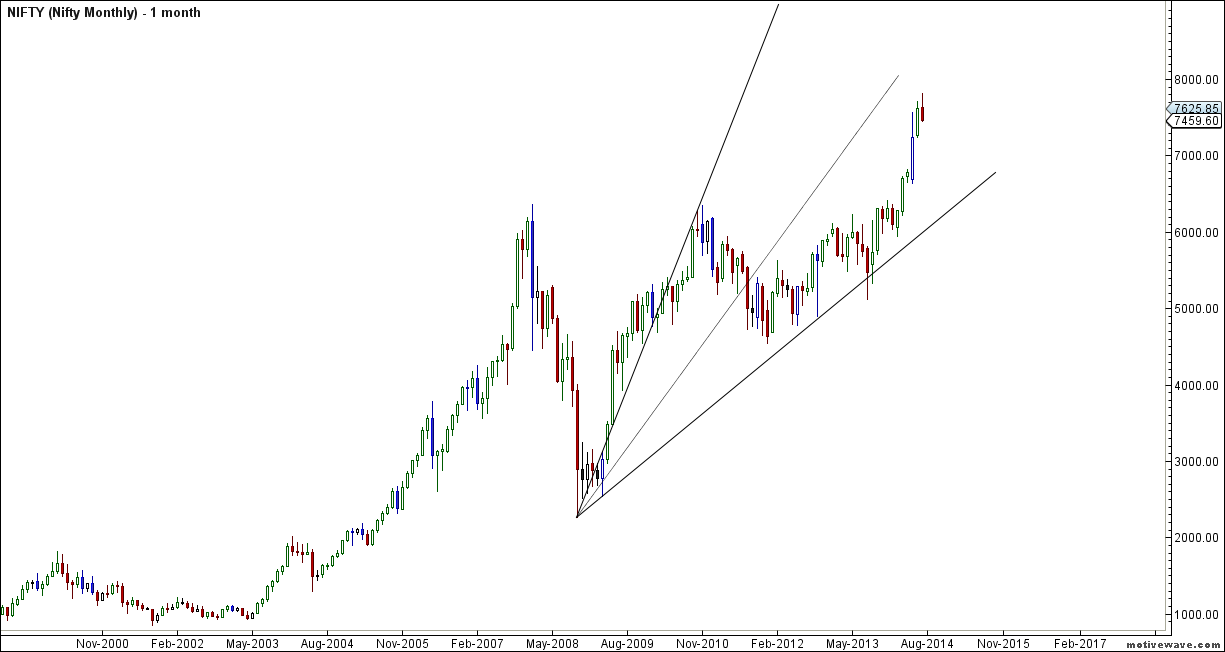
Monthly chart gives a target of 8023 for short term as per Fibo ratio theory
Nifty Weekly Chopad Levels
Nifty Trend Deciding Level:7441
Nifty Resistance:7506,7571,7636
Nifty Support:7380,7334, 7246
Levels mentioned are Nifty Spot
Let me go by Disclaimer these are my personal views and trade taken on these observation should be traded with strict Sl
Want to see post in your Inbox,Register by adding your email id in Post in your Inbox section
Follow on Facebook during Market Hours: https://www.facebook.com/pages/Brameshs-Tech/140117182685863