Last Week we gave Chopad level of 6790, Nifty did 2 target on downside . Lets analyze how to trade Nifty for 1 week before the exit polls results
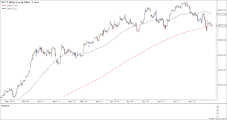
Nifty Hourly Chart

Nifty Hourly charts took exact support at 200 HSMA, Holding the same bounceback till 50HSMA can be seen.
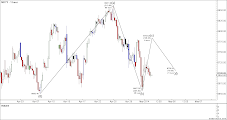
Nifty Elliot Wave Analysis

As per EW analysis it shows short term correction is over till 6640 is not broken and bounce back till 6783 is on cards.
Nifty Daily Chart

On daily charts, nifty has formed a bearish engulfing pattern also nifty is near its Gann Arc support, holding the same we can see a good bounceback.
Nifty Gaps
For Nifty traders who follow gap trading there are 7 trade gaps in the range of 5300-6400
- 5285-5303
- 5448-5553
- 5680-5700
- 5780-5802
- 6091-6108
- 6328-6339
- 6401-6413
- 6493-6510
- 6641-6643
Fibonacci technique
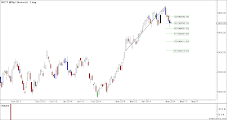
Fibonacci fan

Nifty Fibonacci fan are wonderful tool to find the top and bottom in short term.Nifty is trading at its fibo fan resistance,pullback is also shown as discussed in previous analysis

As per Fibo retracement ,only a close below 50% retracement of 6641 will be short term negative for nifty for target of 6587
Nifty Weekly Chart

It was negative week, with the Nifty down by 87 points closing @6694. Nifty is again taking resistance at its rising trendline and now nearing support at rising trendline, Also as per time analysis Nifty is done with correction and next week should be positive.

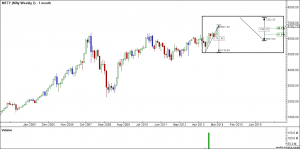
Trading Monthly charts
Monthly chart gives a target of 7322 for short term as per Fibo ratio theory
Nifty Weekly Trading Levels
Nifty Trend Deciding Level:6726
Nifty Resistance:6780,6844,6905
Nifty Support:6644,6587 and 6520
Levels mentioned are Nifty Spot
Let me go by Disclaimer these are my personal views and trade taken on these observation should be traded with strict Sl
Want to see post in your Inbox,Register by adding your email id in Post in your Inbox section
Follow on Facebook during Market Hours: https://www.facebook.com/pages/Brameshs-Tech/140117182685863

