Last Week we gave Chopad level of 6726, Nifty did 2 target on upside and 1 target on downside .Nifty has gained 17 % since Sept. 13 when NaMo was officially anointed as Prime ministerial candidate. Exit poll and outcome of the election. IIP, WPI and CPI data due next week. Lets analyze how to trade Nifty before the Lok Sabha election results.
Nifty Hourly Chart
Nifty Hourly charts took a flying start as soon at 6700 got broken and reached new high. Hourly chart shows potential to up till 6946 on MOnday.
Nifty Elliot Wave Analysis
As per EW analysis it shows short term correction is over till 6640 is not broken and bounce back till 6783 is on cards. This is what we discussed last week Nifty made low of 6638 and bounced back heavily, Now as per EW we get 2 short term target of 7080 and 7227.
Nifty Daily Chart
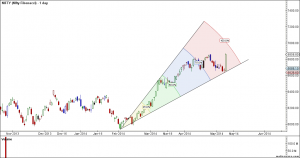
Nifty took perfect support at gann arc as shown above and bounce back heavily, Short term target as per gann arc come at 7070.
Nifty Gaps
For Nifty traders who follow gap trading there are 7 trade gaps in the range of 5300-6400
- 5285-5303
- 5448-5553
- 5680-5700
- 5780-5802
- 6091-6108
- 6328-6339
- 6401-6413
- 6493-6510
- 6641-6643
Fibonacci technique
Fibonacci fan
As per Fibonacci Arcs using gann angles target comes at 7250 around 21-25 may. May comes earlier also.
As per Fibo retracement ,only a close below 50% retracement of 6641 , Nifty made a low of 6638 and bounced back. Fibo extension gives target of 7098 and 7236 in short term.
Nifty Weekly Chart
It was positive week, with the Nifty up by 164 points closing @6858. As per Andrew Pitchfork this move can extend another 2-3% easily giving target of 7050 next week, Also as per time analysis Nifty is trading in positive time zone so dips should be bought in this zone.
Trading Monthly charts
Monthly chart gives a target of 7322 for short term as per Fibo ratio theory
Nifty Weekly Trading Levels
Nifty Trend Deciding Level:6873
Nifty Resistance:6940,7067,7173,7246,7376 and 7506
Nifty Support:6790,6727.6638,6587 and 6520
Levels mentioned are Nifty Spot
Let me go by Disclaimer these are my personal views and trade taken on these observation should be traded with strict Sl
Want to see post in your Inbox,Register by adding your email id in Post in your Inbox section
Follow on Facebook during Market Hours: https://www.facebook.com/pages/Brameshs-Tech/140117182685863


Thanks a lot Brameshji. Have learnt a lot from you and make my own analysis. U’ve have an open mind n down to earth approach taking all pros n cons.
This is an analysis with a heavy positive bias. The disclaimer at the end is a formality which does not cover the eventuality that anything can happen in the markets. Many small traders follow Bramesh almost blindly and have often benefited from his projections.Nevertheless, it must be emphasised that volatility in the coming week is likely to be very high. There may be heavy whipsaws. Also, traders must always remember what happened in 2009. The dates are similar !
Dear Sir,
I always try to analyze what price is showing, If you have been following my last week post the i have been telling a big move is coming, Market tested our patience by moving down to 6638 but rewards of patience was beyond imagination.
So lets trust the price and stick to levels which are mentioned to take ride of both upside and downside whatever is in store in coming week.
Rgds,
Bramesh
Good analysis. Go ahead. Blessed you.