


Last week was roller coaster ride for Stock market traders/investor. Market opened up with huge gap up on BJP state election victory and blue channels were saying target of 6700-6800. Correction started on same day and in next 4 trading days nifty corrected 254 points and now many analyst is calling for target of 6000 sub levels. So with a fall of just 250 points how sentiments moved from extreme bullishness to excessive bearishness. In such taxing times only saviour for trader is to have a trading system and trust the same.
Nifty Hourly Chart
Nifty Hourly charts looks like a chart of mid cap low liquid stock with so many gap down, Positive divergences visible on Hourly chart Holding 6141-6170 range pullback till 6287 is on cards.

Nifty Daily Chart
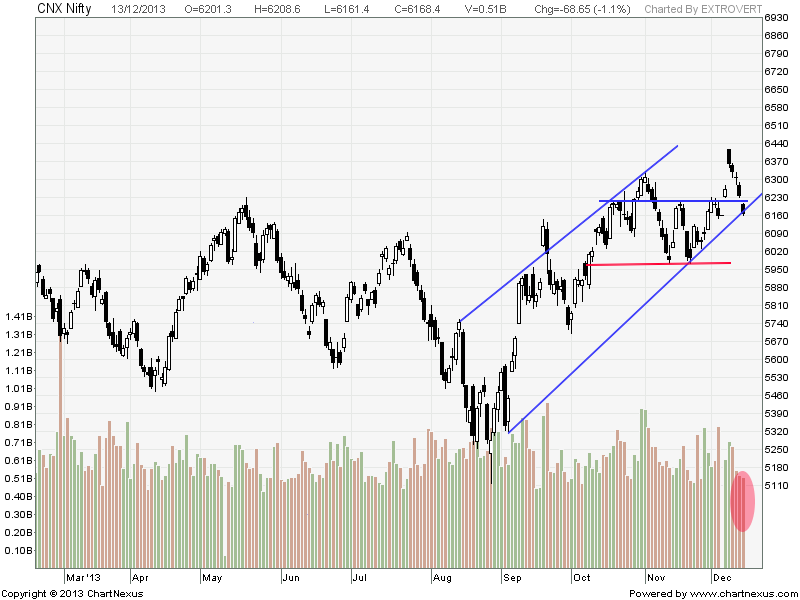
As seen in above chart Nifty is nearing the rising trendline which has given support in last many falls, holding the same we can see a decent bounceback in next week. Volumes have been quiet low in recent fall signalling no major delivery based selling. Also correction will be very healthy for market. Also traders who follow wave analysis do not Nifty took 3 days to move from 6160-6415 but took 5 days to fall back to 6160 signalling a slow fall but fast rise this calls for a bullish case. Also as per time analysis nifty can see a turn date around 17 Dec.
Nifty Gaps
For Nifty traders who follow gap trading there are 9 trade gaps in the range of 5300-6400
- 5285-5303
- 5448-5553
- 5680-5700
- 5780-5802
- 6030-5995
- 6092-6103
- 6332-6308
- 6307-6287
- 6237-6208
Fibonacci technique
Fibonacci fan

Nifty Fibonacci fan are wonderful tool to find the top and bottom in short term.Nifty made the life high of 6417 at resistance of Fibo Fan. I have uploaded the chart in FII data analysis on Monday signalling a correction is underway.Support comes at 6091 as per Fibo fan.
 Fibo Retracement also signalling support at 6141.
Nifty Weekly Chart

Trading Monthly charts

Nifty has formed a gravestone doji candle on Monthly charts, Monthly momentum is still on upside till 6091 is not broken.
Nifty Trading Levels
Nifty Trend Deciding Level:6187
Nifty Resistance:6237,6287 and 6335
Nifty Support:6141,6091 and 6057
Levels mentioned are Nifty Spot
Let me go by Disclaimer these are my personal views and trade taken on these observation should be traded with strict Sl
Want to see post in your Inbox,Register by adding your email id in Post in your Inbox section
Follow on Facebook during Market Hours: https://www.facebook.com/pages/Brameshs-Tech/140117182685863