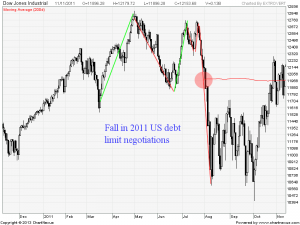
US Debt ceiling suspense will get over by 17 October, Markets are confident that US Politicians will come back together and raise the debt limit.
But if we go through the History back in 2011, Stock Markets correction actually took place once an agreement was reached so will the same be repeated again ?
Next few days will unravel the mystery us the answers to the above questions, Lets understand whats price action on charts is telling us.
Dow Chart in after 2011
After a 2010-2011 surge helped by QE2 in November 2010 the DJIA peaked in early August 2011(02 August break) at the same time as a break below the 200 day moving average.
The end of QE2 in June 2011, uncertainty about the US debt limit negotiations and (icing on the cake) a downgrade of the US by S&P on August 5, 2011 (Friday) created the backdrop for a sharp fall.
The target of the pattern about 10,800 and the actual low hit in Oct 2011 (04 Oct) was 10,404. This gave us a high to low fall of 19% in the DJIA.
Dow Chart in Current Scenario
In current scenario a double top has formed and The rising 200 day moving average now at 14,728 also needs to be watched on a closing basis. The target on a break of this range would be 13,800-13,900 or about 12% high to low.


