


- FIIs sold 36087 Contracts of Index Future ,worth 1076 cores with net Open Interest decreasing by 26089 contracts, FII kept booking profit in Longs they rollovered. Trading Success Mantra from John Murphy
- As discussed in Weekly Analysis, Nifty is approaching near the crucial support of 5930 which is 38.3% Fibo Support and Trend line crossover also.Shorts can do partial profit booking in this range. Also we have 100 SMA@5897 and 50 SMA@5868 which will again act as support and shorts can book profit near this levels.

- Nifty Future June Open Interest Volume is at 1.38 cores with liquidation of 13.6 lakhs in Open Interest,Longs are liquidating their positions.

- Total Future & Option trading volume at 1.06 lakh with total contract traded at 2.2 lakh , PCR (Put to Call Ratio) at 0.98.VIX is again back above 17.29 trading well above 200 SMA and forming a symmetrical triangle which if gives a breakout can spell trouble for Nifty Bulls.
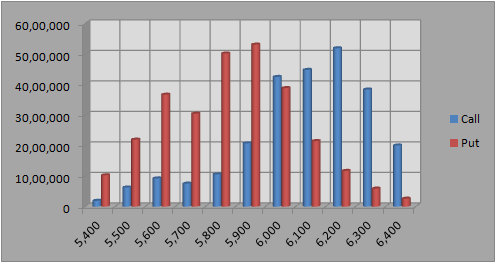
- 6200 Nifty CE is having highest OI at 51.9 lakhs with addition of 11.8 lakhs in OI , 6000 CE with OI at 42 lakhs remains the wall of resistance 6100 CE added 8 lakh in OI with net OI at 44 lakhs.5700-6200 CE added 32 lakh in OI
- 5900 PE is having OI of 53 lakhs suggesting 5900 will act as support.6000 PE liquidated 11 lakhs bear ran for cover, 5800-6300 CE liquidated 3.3 lakh in OI
- FIIs sold in Equity in tune of 87 cores,and DII sold 72 cores in cash segment ,INR closed at 56.72,heading for life high USD-INR will it hit life highs, Weekly forecast
- Nifty Futures Trend Deciding level is 5985 (For Intraday Traders).Nifty Trend Changer Level 6042 and Bank Nifty Trend Changer level 12553.Nifty Future made the exact top at 6119 which was Trend Changer level on Friday and Nifty Traders are almost in profit of 200 points in 2 days Not bad
 Partial Profit Booking is always advisable.
Buy above 5956 Tgt 5980,5995 and 6011(Nifty Spot Levels)
Sell below 5930 Tgt 5897,5868 and 5850(Nifty Spot Levels)
Stock Performance Sheet for the Month of May is Updated @http://tradingsystemperformance.blogspot.in/ Net Profit for the month of May is 187775/-
Live Nifty A/D charts Click on the Link
Traders who use Pivot and Camarilla can use the following 2 sites for Hourly values and EOD values
http://camarillapivotpoints.blogspot.com/
http://niftystockpivot.blogspot.in/
We do discussion in Live market to update Nifty levels If you are interested you can LIKE the page to get Real Time Updates.
Follow on Facebook during Market Hours: http://www.facebook.com/pages/Brameshs-Tech/140117182685863
T3 6111 is that right?
Hello Ramen
Its 6011
Rgds,
Bramesh