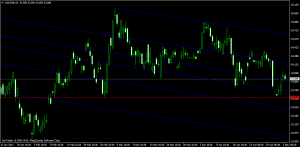
USD INR 4 Hour Chart
USD INR 4 hour chart is trading in a downtrending channel,with support coming at 53.84. On Upside range of 54.18-54.21 is all important zone of resistance. So range bound move to continue.
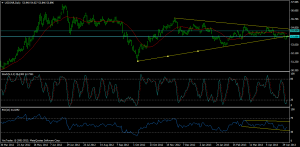
USD INR Daily Chart
As per Daily charts INR is trading below 20 DMA.USD INR broke the rising trendline for 2 days but quickly recovered and closed just near the trendline level of 53.90. Next important resistance on upside comes at 54.20
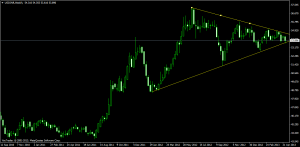
USD INR Weekly Chart
Weekly charts are trading in a perfect symmetrical triangle, with support at 53.61 and resistance falling down 54.64 and forming a pennant formation and large breakout will ensue but in due course of time. Range bound moves to continue till than.
USD – INR Trend Deciding Level:54.15
USD – INR Resistance:54.55,55,55.44
USD – INR Support:53.70,53.25 and 52.80
Levels mentioned are USD – INR May Future
Follow on Facebook during Market Hours: http://www.facebook.com/pages/Brameshs-Tech/140117182685863


