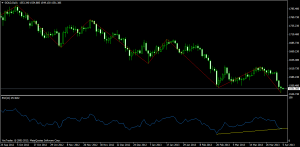
Gold Hourly Chart
Gold 4 Hour chart with Fibo regression channels,is shown Gold is trading between conflunce of Fibo channels, with stif resistane at 13 ema low shown in red line. Gold will show wild moves today as US job data will be announced Bad data means more easing and gold can see a rise today till 1576$, Good data means fed hawk will not go for more easing and strong support of $1526 will be in danger.
As per daily charts gold has taken support at zig zag lines of 1539 and bounced back,Positive divergence can be seen in RSI.
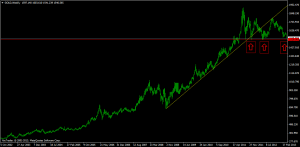
Gold Weekly
As per Weekly charts gold is nearing very important 2 year support of 1526 which has resulted in swift pullback last 3-4 times.Traders holding shorts can book out 60% of short near 1526 levels which should eventually come by today or tomorrow. Trend is Sell on Rise keeping strict SL of 1556$
Buy above 1556.5 Tgt 1560,1567 and 1576 SL 1549
Sell below 1548 Tgt 1544,1539 and 1526 SL 1556
Follow on Facebook during Market Hours: http://www.facebook.com/pages/Brameshs-Tech/140117182685863


