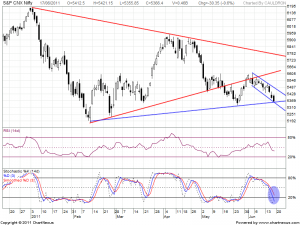
Nifty Hourly Chart
Nifty Hourly chart shows the last support where a Bounce can be expected is last swing low of 5325. Hourly Chart are still in selling channel as shown in above chart and a close above 5391 and 5440 are important resistance levels.
Nifty Daily
Nifty Daily is again moving in a parallel downward trending channel and No Sign Of Reversal Seen On Daily Charts. Till we are unable to cross above 5440 there is no reversal on cards and rallies should be used to short the market on higher side.
There are Few Positive Developments which i can see
1. Monsoons on Track which will help in getting a good Agriculture output.
2. Cool off in Crude Prices is good for indian economy.
3. Increase in Advanced tax Number is also showing Slowdown is not in insight in-spite of High Interest rate envioement.
All Said and Done Market is supreme and Please trading on your Trading system
Volumes were on Lower side when Nifty broke 5400 indicating the selling is not fierce.
Nifty Weekly
The Trend In Weekly And Monthly Charts Remains Down and no reversal signal are seen which indicates that larger trend is still down and Shorting at right levels can yield good profit.
Most Important Level to watch for this week is 5325– The last swing low . If market held this Level we are in for a bullish ride as it will indicate a formation of Higher lows which is a Bullish indicator.
Nifty range is narrowed again from 5350-5440 so please trade this range. Buy at support and Sell on resistance will be a good stratergy for this week till last Week low of 5456 is not broken.
Levels to watch
Trend Deciding Level:5414
Resistance:5472,5555
Support:5356,5325 and 5250


