


Disclaimer
This analysis represents the highest-probability forecast derived from expert, multi-decade historical evaluation of astrological signatures and their documented correlation with market psychology and price action.
No Guarantee
This is not a guarantee of future market performance. Financial markets are influenced by numerous dynamic and unpredictable real-world factors. All trading and investment activities carry significant risk, including the potential loss of principal.
Educational Purpose Only
This content is strictly for informational and educational purposes and should not be construed as financial advice or a recommendation to buy, sell, or trade any financial instrument.
Consult a Professional
We strongly advise you to consult a qualified financial advisor before making any investment decisions. Any actions you take based on this analysis are solely your responsibility. We assume no liability for any financial profits or losses that may occur.
Theme for Nifty & Sensex: The Over-Extended Rally and the Lunar Reality Check
The Nifty has surged 1337 points, leaving it technically vulnerable to a mean-reversion move. The failure of the peace talks provides the fundamental excuse, but the astrology provides the timing. The early week will see the market struggle to digest the negative news and the Mars Zero energy. The critical test arrives mid-week. IF the Nifty forms a topping pattern (e.g., a bearish engulfing candle) on or around the Nifty Gann Date (Wednesday) and the Lunar Eclipse degree date (Tuesday), THEN it validates an exhaustion top and initiates a sharp corrective swing. The deceptive energy of Rahu SR on Tuesday warns that price action will be erratic and designed to trap late buyers.
For a Detailed Day by Day Forecast with Neural Analysis Please watch the below video
SENSEX Harmonic Pattern
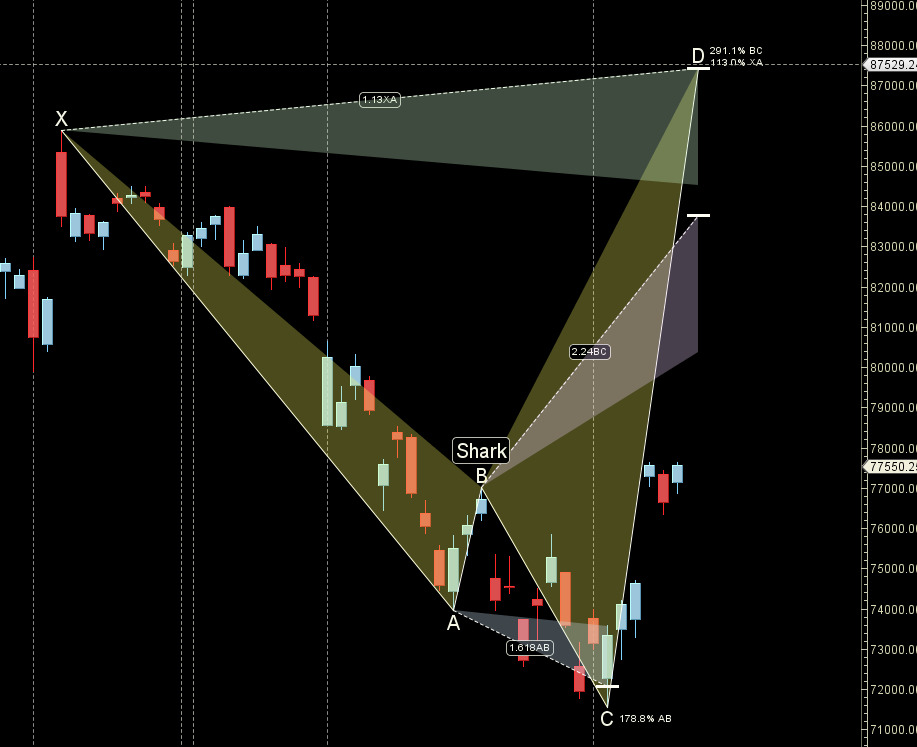
Till 76300 is held we can see upmove till 79000
SENSEX Gann Angles
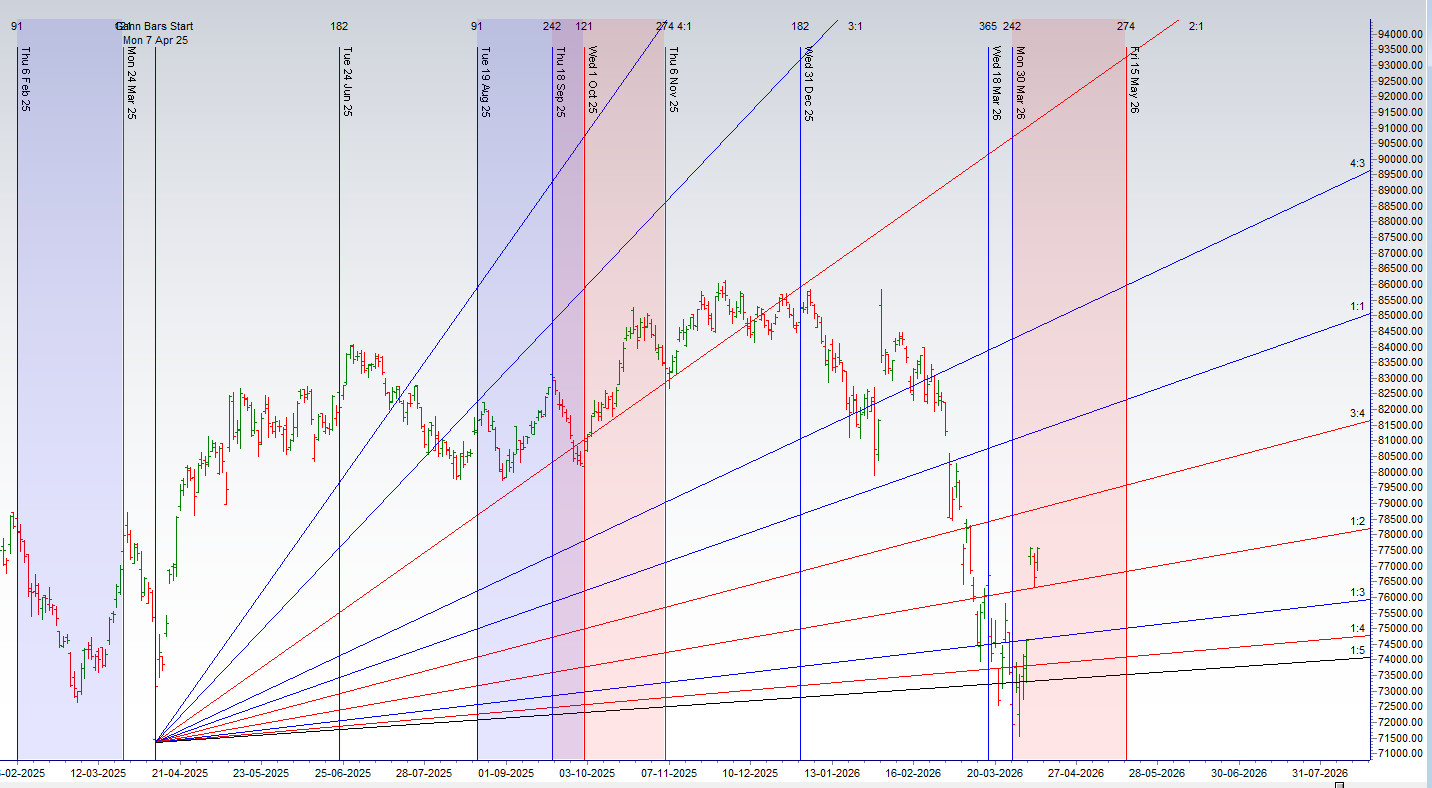
Sensex has held on to its 1×2 gann angle heading to 3×4 gann angle towards 79000
SENSEX Supply and Demand
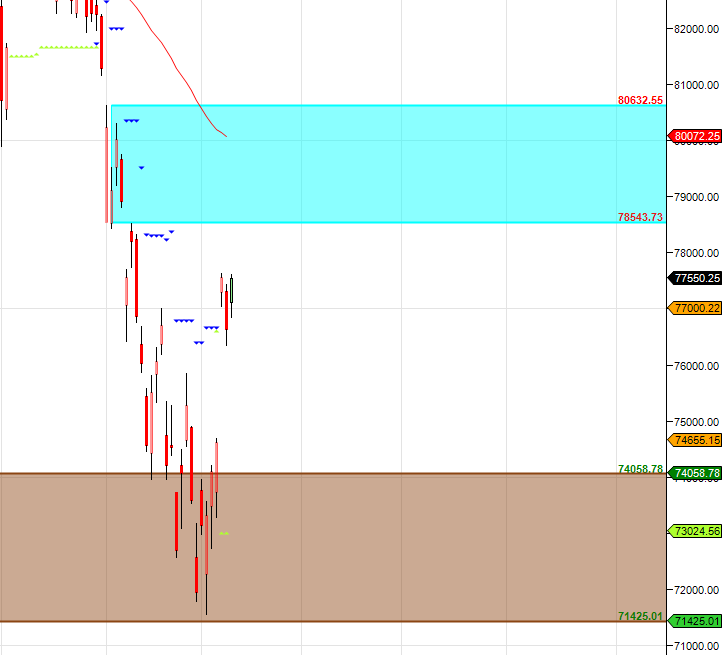
Self Explanatory Chart
SENSEX Time Analysis Pressure Dates
Key Pivot Dates: Watch 13/17 April
SENSEX Weekly Chart
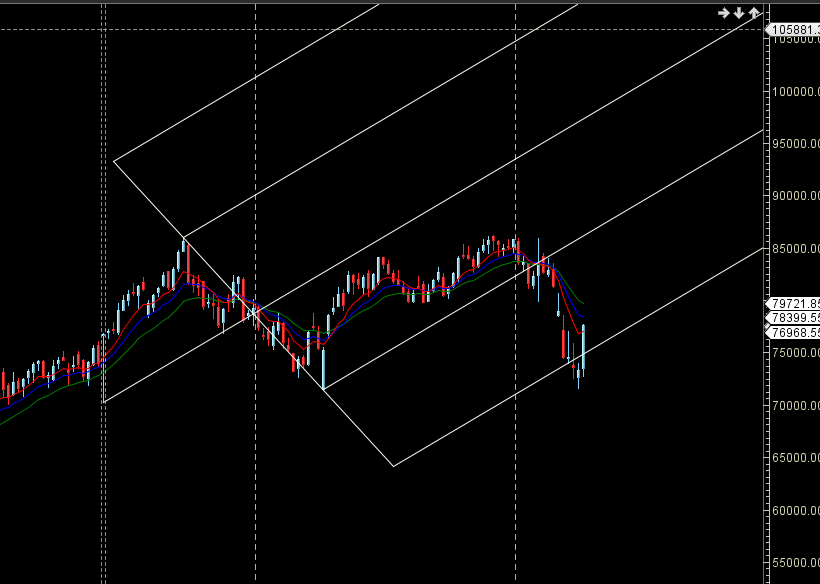
Sensex rallied big time from AF support zone range of 78400-78500 is supply zone.
SENSEX Monthly Charts
79000 is Monthly resistance zone 76300 is Support zone.
SENSEX Weekly Levels
SENSEX Trend Deciding Level: 77176
SENSEX Resistance: 77453 77729 78005 78282 78558
SENSEX Support: 76900 76624 76347 76000 75777
Levels mentioned are SENSEX Spot
Learn More:
W.D. Gann Trading Strategies – Learn how to decode markets using price, time, and geometry.
Trading Using Financial Astrology – Discover how planetary motion impacts market behavior and how to trade it effectively.
Ready to Trade Like a Time-Master?
Join our one-on-one mentorship to master astro-timing, Gann analysis, and institutional-grade setups.
Call: 09985711341
Email: bhandaribrahmesh@gmail.com