


Disclaimer
This analysis represents the highest-probability forecast derived from expert, multi-decade historical evaluation of astrological signatures and their documented correlation with market psychology and price action.
No Guarantee
This is not a guarantee of future market performance. Financial markets are influenced by numerous dynamic and unpredictable real-world factors. All trading and investment activities carry significant risk, including the potential loss of principal.
Educational Purpose Only
This content is strictly for informational and educational purposes and should not be construed as financial advice or a recommendation to buy, sell, or trade any financial instrument.
Consult a Professional
We strongly advise you to consult a qualified financial advisor before making any investment decisions. Any actions you take based on this analysis are solely your responsibility. We assume no liability for any financial profits or losses that may occur.
Theme: The Blue-Chip De-Risking and The Value Accumulation
Act I (Start of Week – Monday): The Flight to Cash vs. The Flight to Value. The Sensex will bear the brunt of institutional de-risking as the geopolitical shock hits. Foreign funds will seek to reduce exposure to high-weightage equities. The Rahu SR astrological influence ensures this selling is driven by anxiety. However, the Venus in Taurus ingress is profoundly impactful for the Sensex, which is composed of large-cap, dividend-paying blue chips. This ingress signals that long-term domestic funds will aggressively accumulate these assets as they are marked down. Monday will be characterized by a tug-of-war between foreign panic selling and domestic value buying. The primary objective is price discovery to the downside, searching for the exact level where the Venusian value buyers overpower the Rahu panic sellers.
For a Detailed Day by Day Forecast with Neural Analysis Please watch the below video
SENSEX Harmonic Pattern
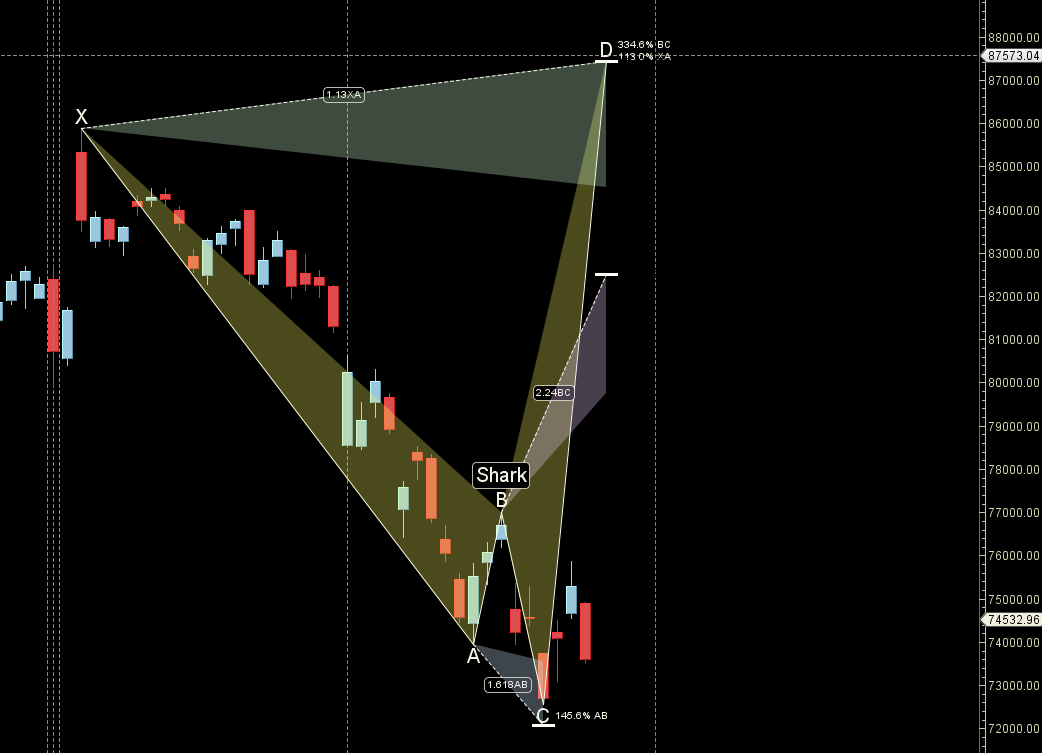
Sensex is approaching its PRZ zone at 74000-73800
SENSEX Gann Angles
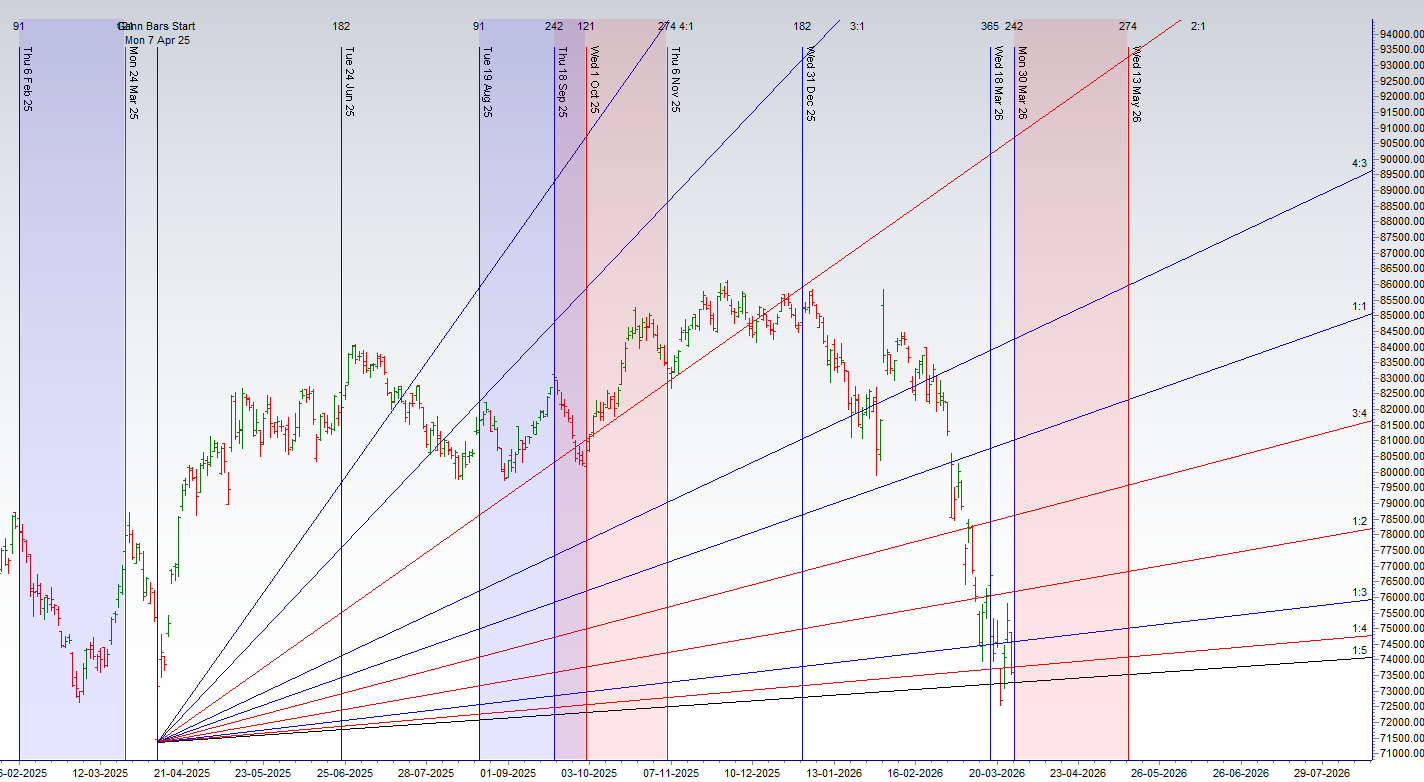
Sensex has broken its 1×4 gann angle
SENSEX Supply and Demand
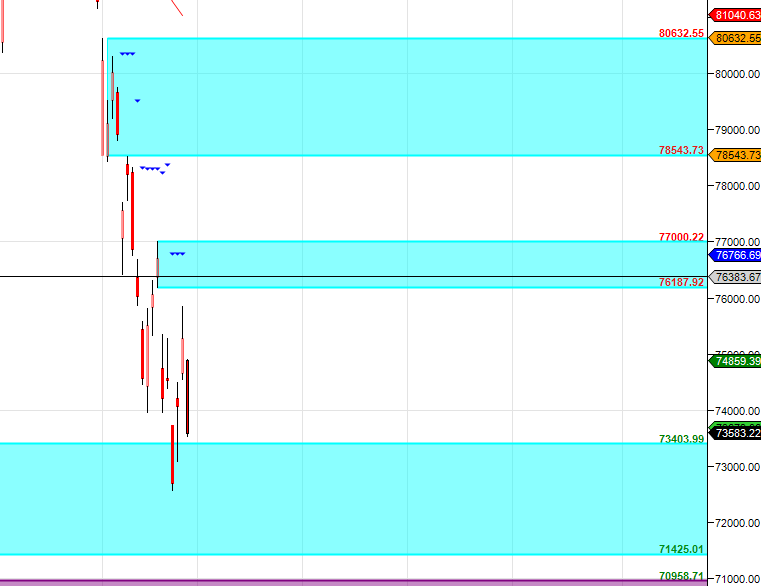
Self Explanatory Chart
SENSEX Time Analysis Pressure Dates
Key Pivot Dates: Watch 30 March/02 April
SENSEX Weekly Chart
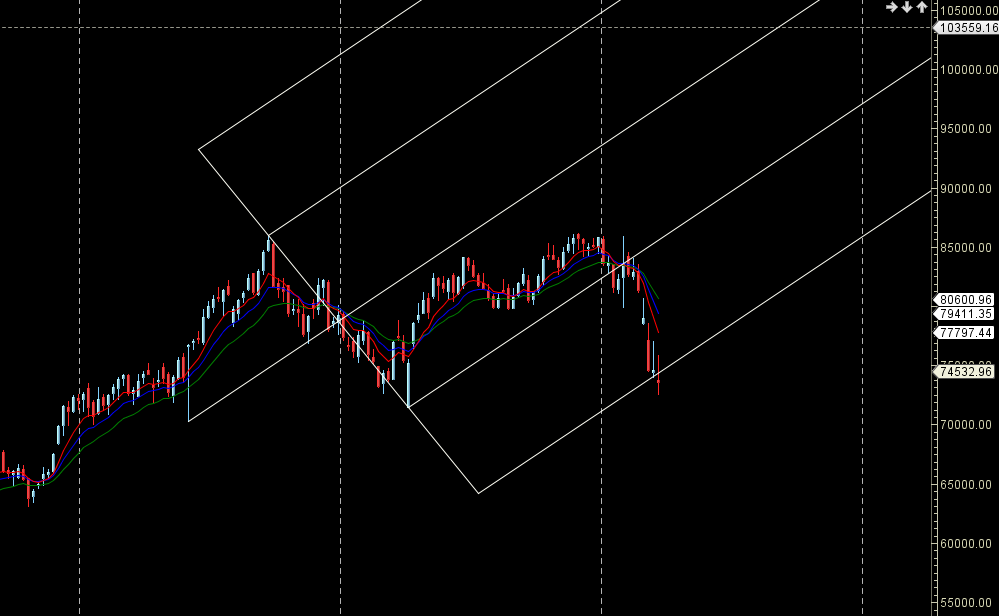
Price is back to its AF Support zone with Weekly DOJI.
SENSEX Monthly Charts
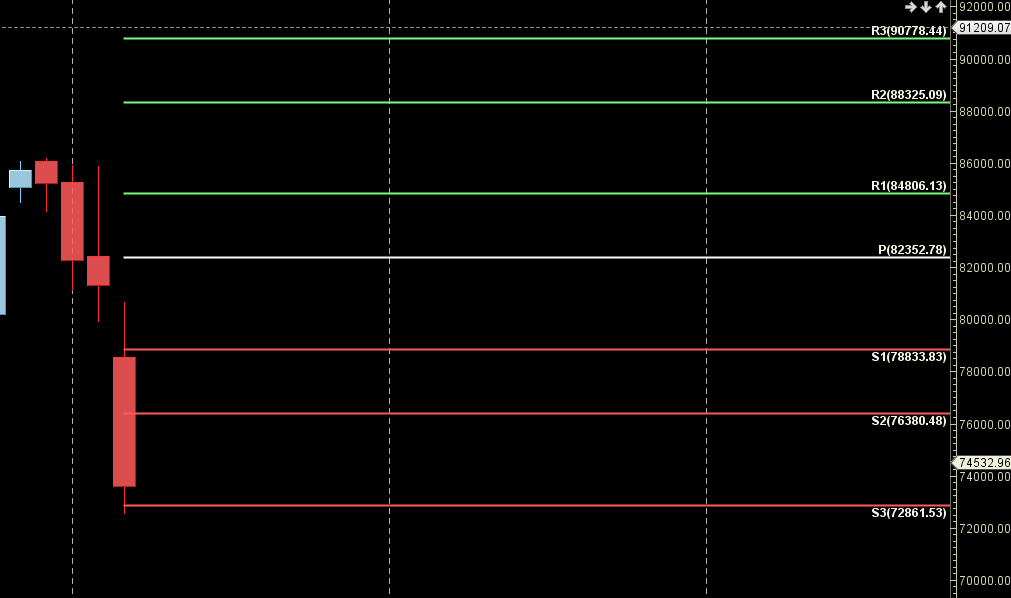
76380 is Monthly resistance zone 72861 is Support zone.
SENSEX Weekly Levels
SENSEX Trend Deciding Level: 73120
SENSEX Resistance: 73662 74205 74752 75299 75849
SENSEX Support: 72580 72043 71507 70973 70441
Levels mentioned are SENSEX Spot
Learn More:
W.D. Gann Trading Strategies – Learn how to decode markets using price, time, and geometry.
Trading Using Financial Astrology – Discover how planetary motion impacts market behavior and how to trade it effectively.
Ready to Trade Like a Time-Master?
Join our one-on-one mentorship to master astro-timing, Gann analysis, and institutional-grade setups.
Call: 09985711341
Email: bhandaribrahmesh@gmail.com