


Disclaimer
This analysis represents the highest-probability forecast derived from expert, multi-decade historical evaluation of astrological signatures and their documented correlation with market psychology and price action.
No Guarantee
This is not a guarantee of future market performance. Financial markets are influenced by numerous dynamic and unpredictable real-world factors. All trading and investment activities carry significant risk, including the potential loss of principal.
Educational Purpose Only
This content is strictly for informational and educational purposes and should not be construed as financial advice or a recommendation to buy, sell, or trade any financial instrument.
Consult a Professional
We strongly advise you to consult a qualified financial advisor before making any investment decisions. Any actions you take based on this analysis are solely your responsibility. We assume no liability for any financial profits or losses that may occur.
Theme: The Expiry Day Washout and The Venusian Floor
-
Act I (Start of Week – Monday): The Expiry Trap and Liquidation. The Nifty is positioned for a severe test at the opening bell. The fundamental geopolitical shock forces a definitive gap-down, breaking immediate psychological support zones. Monday is a Monthly Expiry, altering market mechanics. When this collides with the Rahu SR (amplifying panic) and the Solar Eclipse 360-degree date, the result is a forced liquidation cascade. However, the Venus ingress into Taurus acts as a stabilizing undercurrent. As the index drops, institutional value buyers will step in at major structural floors. Bullish and Bearish Scenarios: IF the Nifty breaks and sustains below its immediate option-based support in the first hour, THEN an acceleration of the downtrend toward the next major macro structural floor is the high-probability outcome. Bulls must step aside and allow the expiry-driven selling to exhaust itself into the Venusian support zones.
For a Detailed Day by Day Forecast with Neural Analysis Please watch the below video
Nifty Harmonic Pattern
No Valid Harmonic Pattern
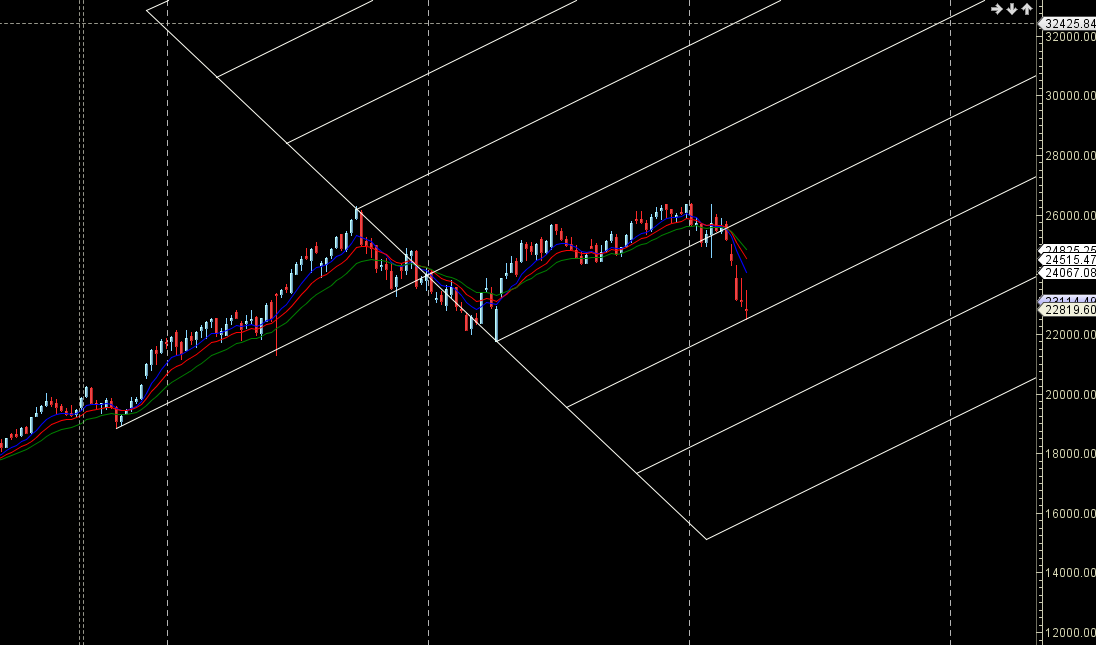
Nifty Gann Angles
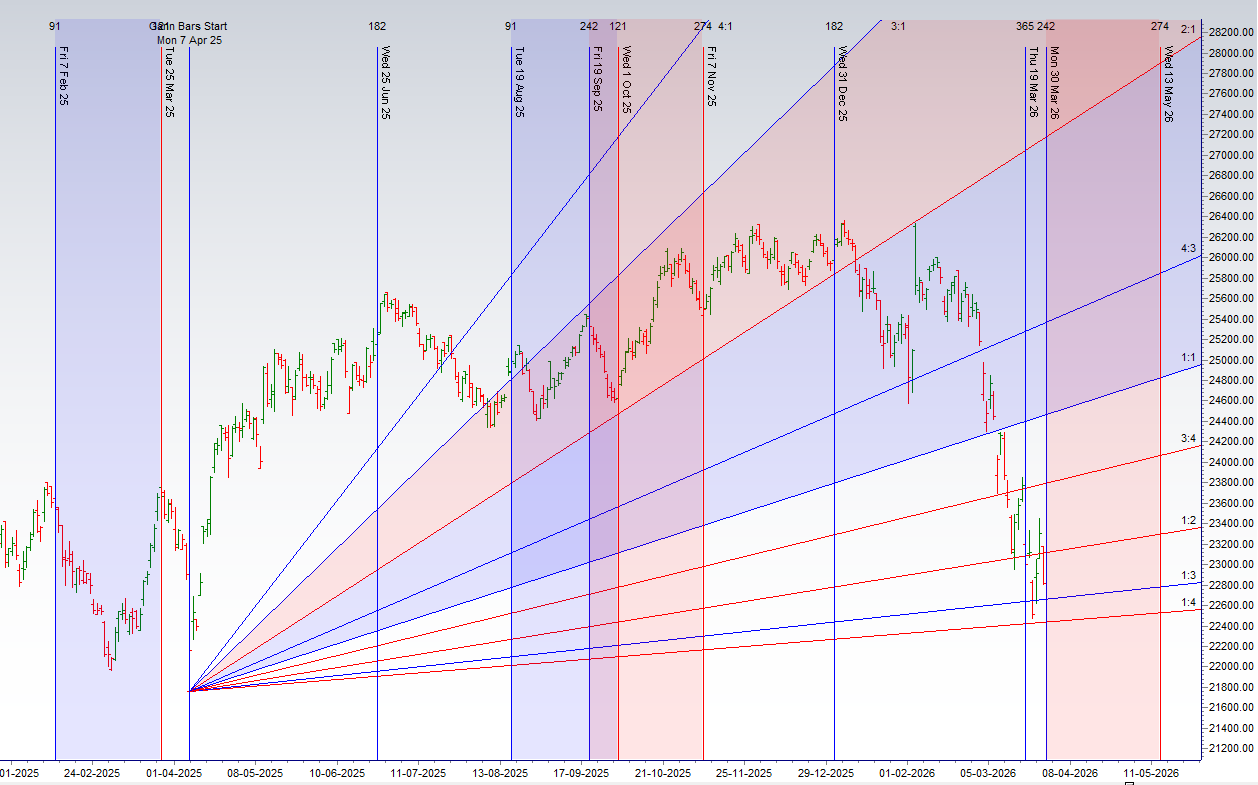
Price is back to its 1×3 gann angles support zone.
Nifty Supply and Demand
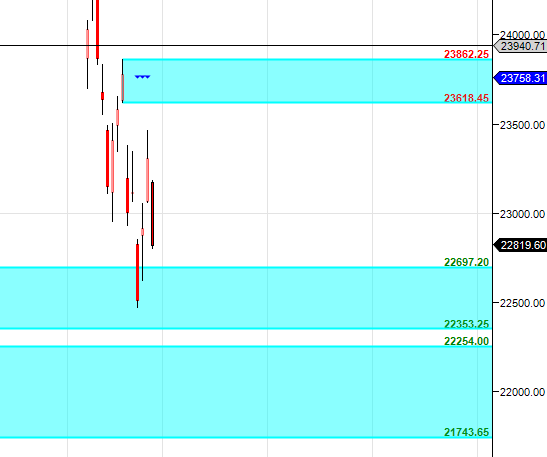
Self Explanatory Chart
Nifty Time Analysis Pressure Dates
Key Pivot Dates: Watch 30 March/02 April
Nifty Weekly Chart
Nifty formed DOJI at AF support zone.
Nifty Monthly
23166 is Monthly resistance zone 22617 is Monthly Support zone.
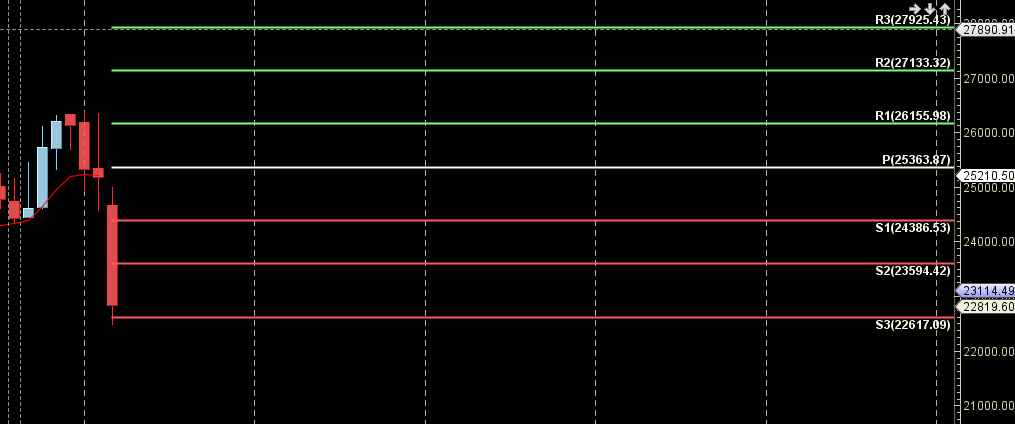
Nifty Weekly Levels
Nifty Trend Deciding Level: 22852
Nifty Resistance: 23005 23159 23312 23465
Nifty Support: 22699 22546 22393 22239
Levels mentioned are Nifty Spot
As always I wish you maximum health and trading success
Learn More:
W.D. Gann Trading Strategies – Learn how to decode markets using price, time, and geometry.
Trading Using Financial Astrology – Discover how planetary motion impacts market behavior and how to trade it effectively.
Ready to Trade Like a Time-Master?
Join our one-on-one mentorship to master astro-timing, Gann analysis, and institutional-grade setups.
Call: 09985711341
Email: bhandaribrahmesh@gmail.com