


Disclaimer
This analysis represents the highest-probability forecast derived from expert, multi-decade historical evaluation of astrological signatures and their documented correlation with market psychology and price action.
No Guarantee
This is not a guarantee of future market performance. Financial markets are influenced by numerous dynamic and unpredictable real-world factors. All trading and investment activities carry significant risk, including the potential loss of principal.
Educational Purpose Only
This content is strictly for informational and educational purposes and should not be construed as financial advice or a recommendation to buy, sell, or trade any financial instrument.
Consult a Professional
We strongly advise you to consult a qualified financial advisor before making any investment decisions. Any actions you take based on this analysis are solely your responsibility. We assume no liability for any financial profits or losses that may occur.
Theme for Nifty : The Exhaustion Gap and The Structural Support Test
The theme for the broader indices is a forced liquidation cascade leading into a critical structural test. The massive opening gap instantly traps retail longs and triggers forced selling, pushing Nifty below 23000 and Sensex below 74000. The indices will be driven lower early in the week under the weight of the Sun-Rahu alignment. The narrative culminates on Wednesday under the Mercury-Jupiter Helio conjunction. This is the “line in the sand” moment. IF the indices defend their secondary structural supports on Wednesday, THEN Friday’s post-holiday reaction has the potential for a short-covering relief rally. Failure to hold support signals a definitive acceleration of the downtrend.
For a Detailed Day by Day Forecast with Neural Analysis Please watch the below video
Nifty Harmonic Pattern
No Valid Harmonic Pattern
Nifty Gann Angles
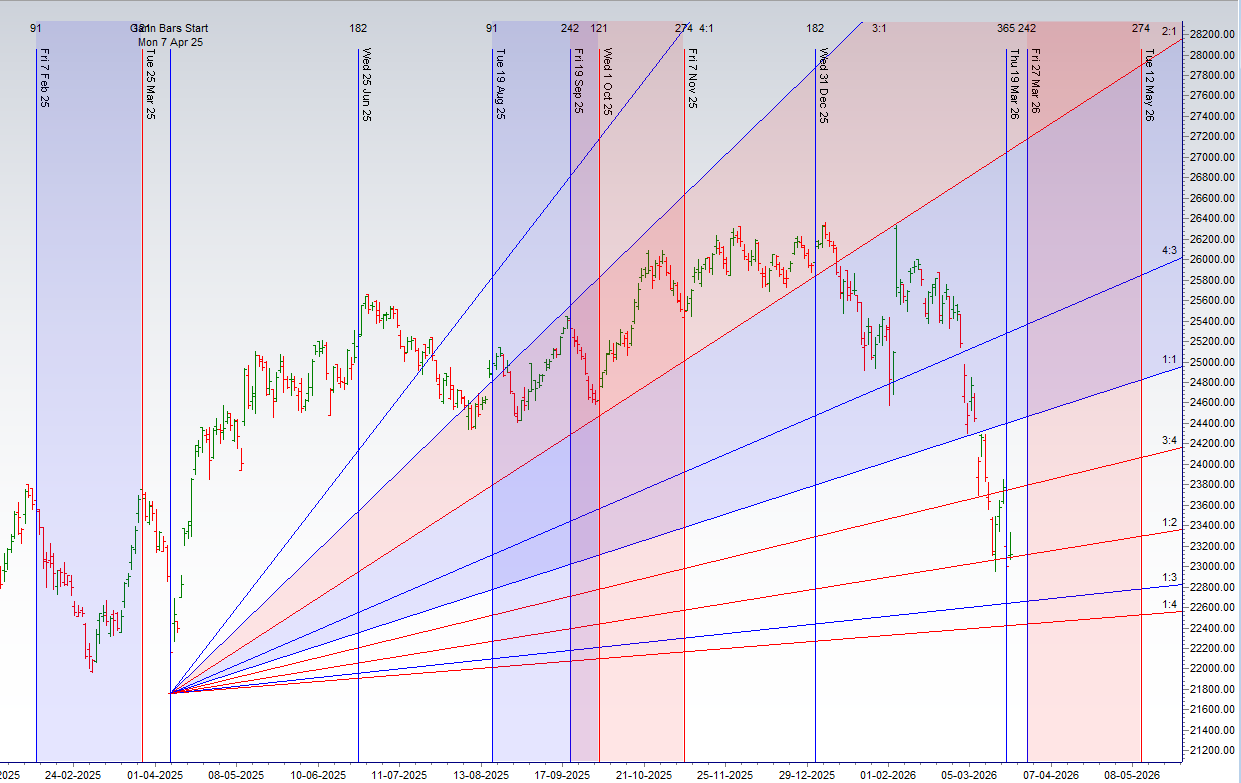
Price is back to its 1×2 gann angles support zone.
Nifty Supply and Demand

Self Explanatory Chart
Nifty Time Analysis Pressure Dates
Key Pivot Dates: Watch 23 March
Nifty Weekly Chart
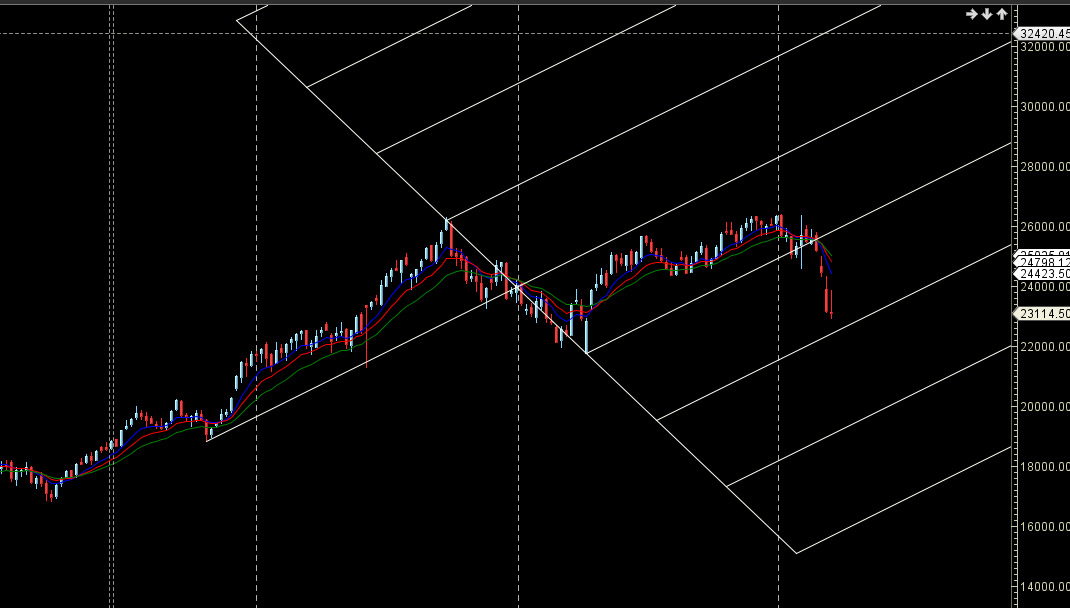
Price reacted from Weekly AF resistance zone and formed lower low
Nifty Monthly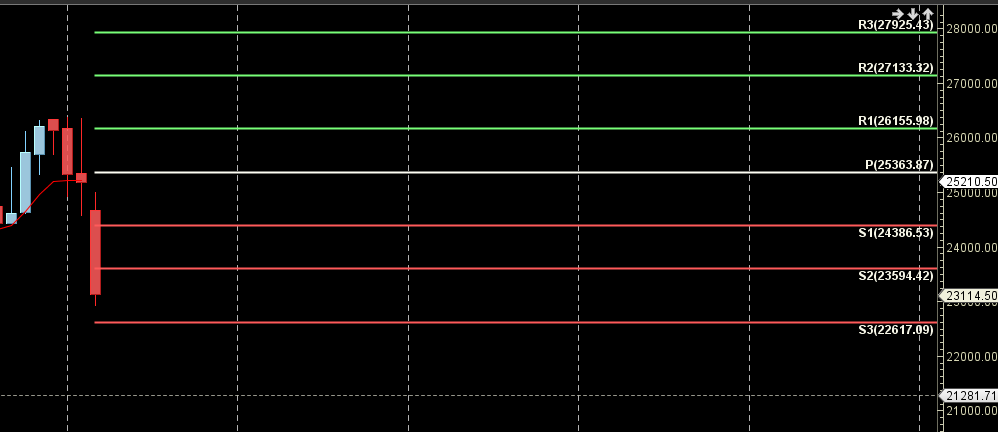
23594 is Monthly resistance zone 22617 is Monthly Support zone.
Nifty Weekly Levels
Nifty Trend Deciding Level: 23215
Nifty Resistance: 23370 23524 23678 23833
Nifty Support: 23061 22906 22752 22598
Levels mentioned are Nifty Spot
As always I wish you maximum health and trading success
Learn More:
W.D. Gann Trading Strategies – Learn how to decode markets using price, time, and geometry.
Trading Using Financial Astrology – Discover how planetary motion impacts market behavior and how to trade it effectively.
Ready to Trade Like a Time-Master?
Join our one-on-one mentorship to master astro-timing, Gann analysis, and institutional-grade setups.
Call: 09985711341
Email: bhandaribrahmesh@gmail.com