


Disclaimer
This analysis represents the highest-probability forecast derived from expert, multi-decade historical evaluation of astrological signatures and their documented correlation with market psychology and price action.
No Guarantee
This is not a guarantee of future market performance. Financial markets are influenced by numerous dynamic and unpredictable real-world factors. All trading and investment activities carry significant risk, including the potential loss of principal.
Educational Purpose Only
This content is strictly for informational and educational purposes and should not be construed as financial advice or a recommendation to buy, sell, or trade any financial instrument.
Consult a Professional
We strongly advise you to consult a qualified financial advisor before making any investment decisions. Any actions you take based on this analysis are solely your responsibility. We assume no liability for any financial profits or losses that may occur.
Theme for Sensex: The Geopolitical Breakdown and The Scheduled Mercury Pivot
This week’s narrative is defined by a brutal collision between geopolitical instability and a heavy, restrictive astrological calendar. The week opens with a definitive shock event, driven by US political rhetoric, forcing a severe gap-down . For SENSEX, this gap down instantly compromises the 74000 psychological support, plunging the market into a state of elevated fear and VIX expansion. The dominant energy of the week is a grueling search for a structural bottom. The Sun-Rahu same Nakshatra alignment on Monday acts as a powerful energy amplifier for this breakdown, explicitly signaling “High Bearish” pressure and forcing aggressive price discovery to the downside.
For a Detailed Day by Day Forecast with Neural Analysis Please watch the below video
SENSEX Harmonic Pattern
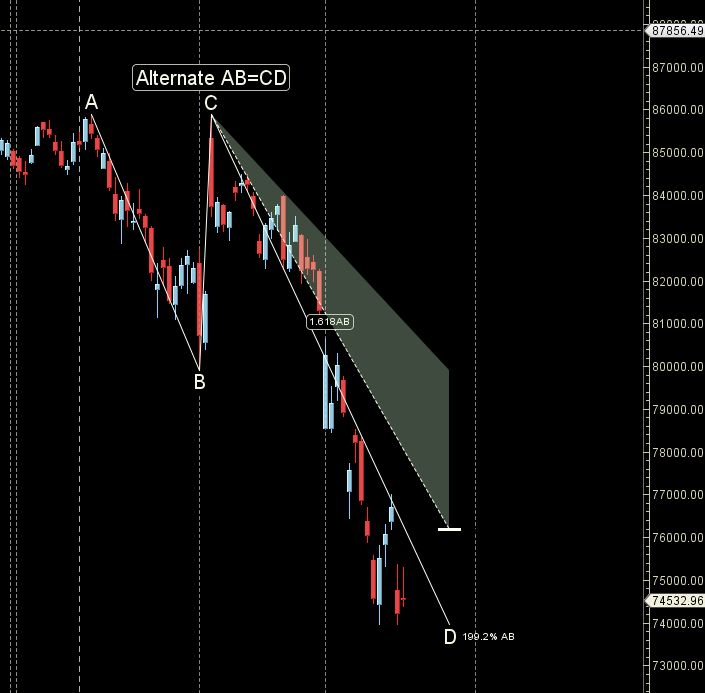
Sensex is approaching its PRZ zone at 74000-73800
SENSEX Gann Angles
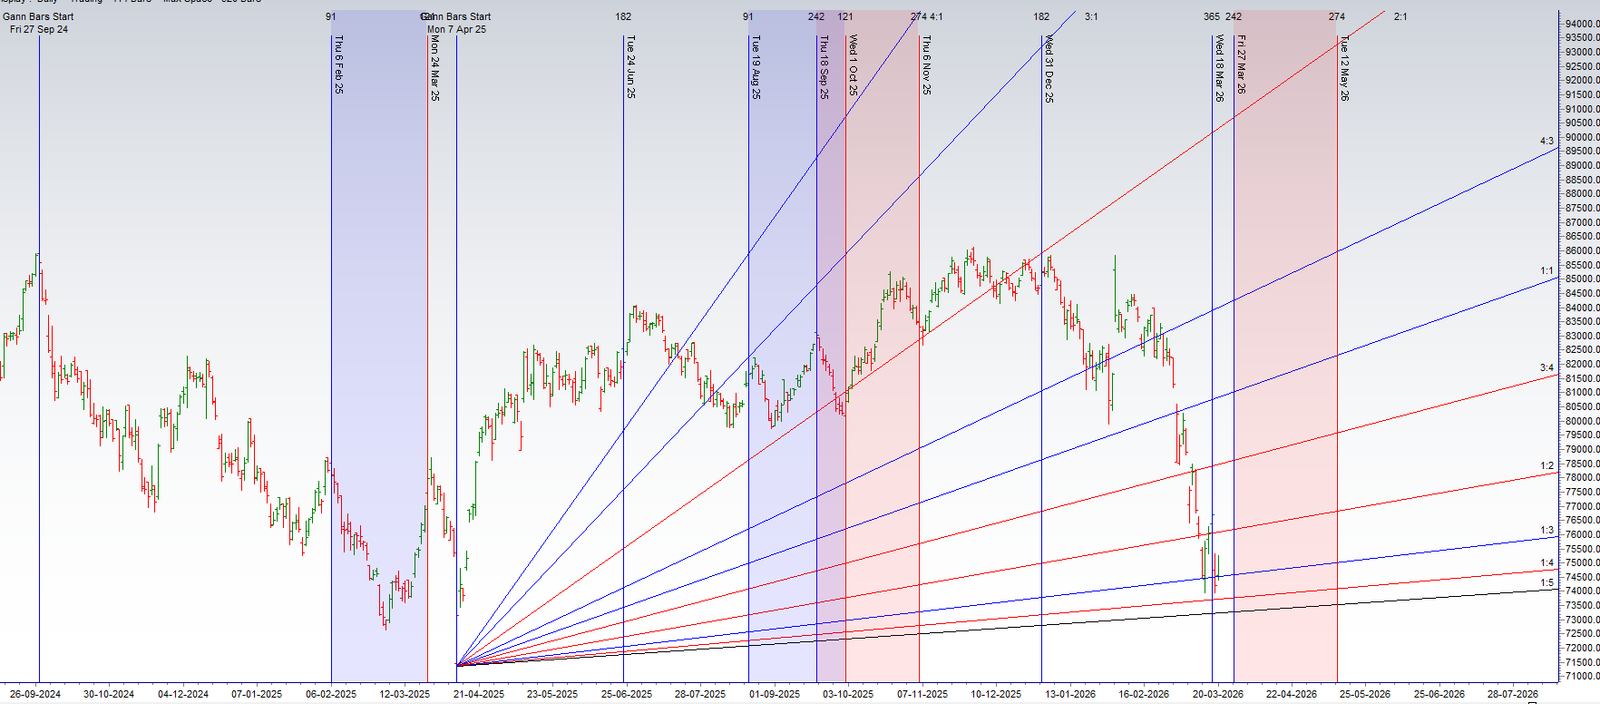
Sensex has broken its 1×3 gann angle
SENSEX Supply and Demand
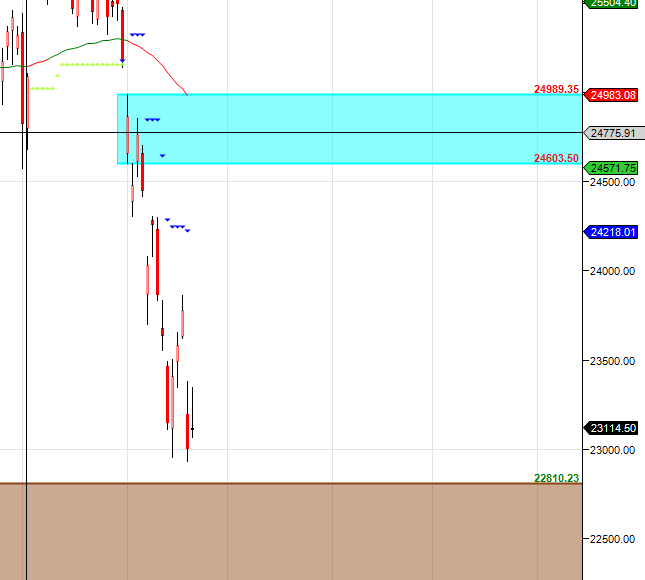
Self Explanatory Chart
SENSEX Time Analysis Pressure Dates
Key Pivot Dates: Watch 23 March
SENSEX Weekly Chart
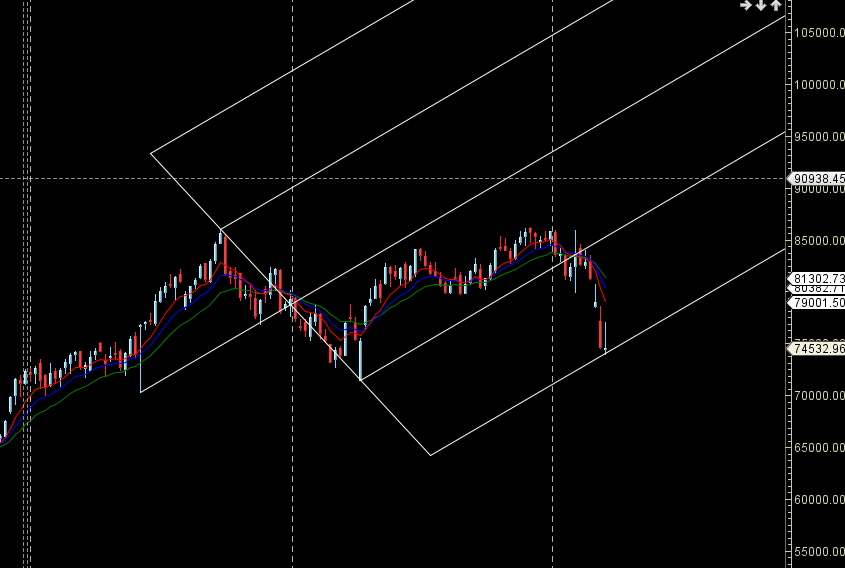
Price is back to its AF Support zone.
SENSEX Monthly Charts
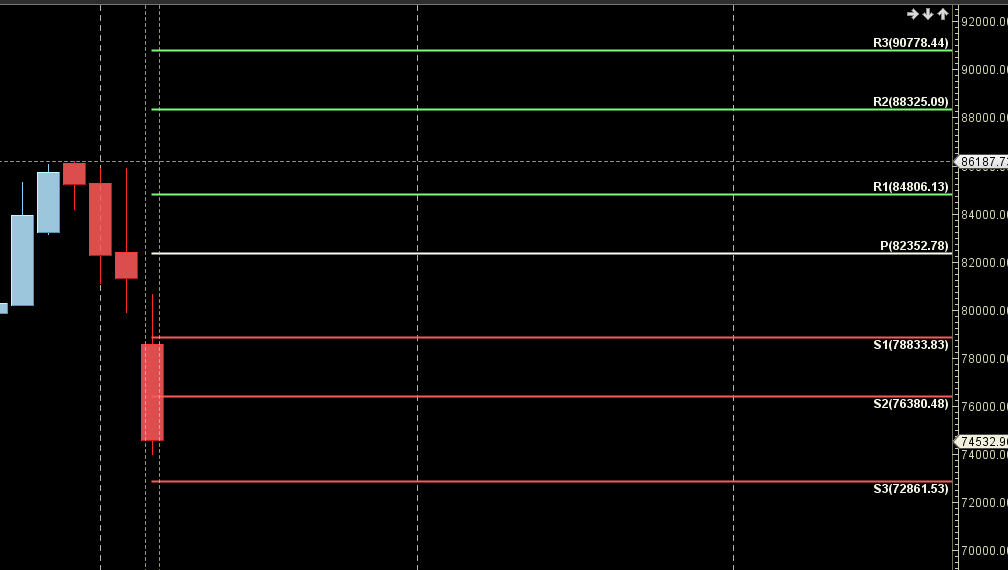
76380 is Monthly resistance zone 72861 is Support zone.
SENSEX Weekly Levels
SENSEX Trend Deciding Level: 74256
SENSEX Resistance: 73981 73707 73432 73158
SENSEX Support: 74530 74805 75079 75354
Levels mentioned are SENSEX Spot
Learn More:
W.D. Gann Trading Strategies – Learn how to decode markets using price, time, and geometry.
Trading Using Financial Astrology – Discover how planetary motion impacts market behavior and how to trade it effectively.
Ready to Trade Like a Time-Master?
Join our one-on-one mentorship to master astro-timing, Gann analysis, and institutional-grade setups.
Call: 09985711341
Email: bhandaribrahmesh@gmail.com