


Disclaimer
This analysis represents the highest-probability forecast derived from expert, multi-decade historical evaluation of astrological signatures and their documented correlation with market psychology and price action.
No Guarantee
This is not a guarantee of future market performance. Financial markets are influenced by numerous dynamic and unpredictable real-world factors. All trading and investment activities carry significant risk, including the potential loss of principal.
Educational Purpose Only
This content is strictly for informational and educational purposes and should not be construed as financial advice or a recommendation to buy, sell, or trade any financial instrument.
Consult a Professional
We strongly advise you to consult a qualified financial advisor before making any investment decisions. Any actions you take based on this analysis are solely your responsibility. We assume no liability for any financial profits or losses that may occur.
Theme for Nifty : The Stress Test of Structural Support
The theme for the broader indices is a battle for survival at major support zones. The 5-7% drop has cleared out weak hands, but the mid-week astrology (Bayer Rule 2) demands a final re-test of the lows. The indices will attempt to use Monday’s Gann Date to establish a floor. The narrative is a tug-of-war: bears attempting to force a cascading liquidation event, and bulls trying to defend extreme oversold levels. IF the Nifty and Sensex can absorb the mid-week astrological pressure without breaking their newly established panic lows, THEN Friday’s Mercury Station Direct acts as the green light for a sharp relief rally.
For a Detailed Day by Day Forecast with Neural Analysis Please watch the below video
Nifty Harmonic Pattern
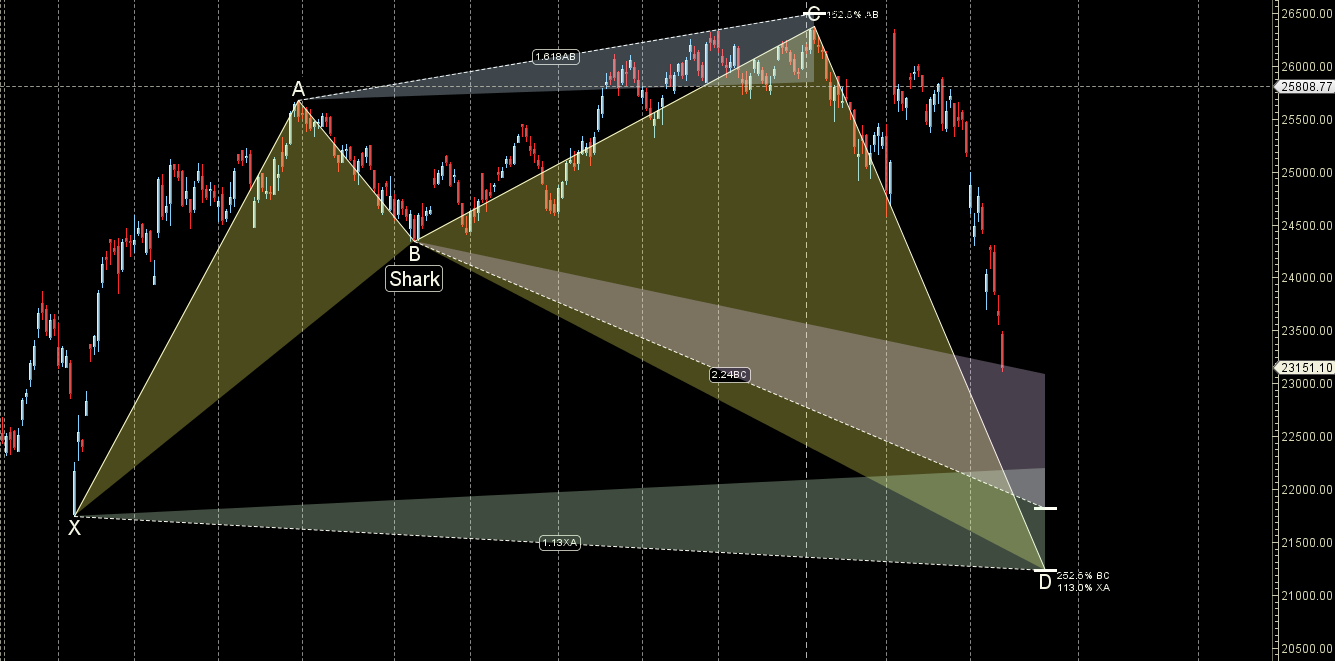
#nifty worst case scenario in current down move PRZ zone of Shark pattern coming in 21821-21500 zone.. bottom only if we close above 23479-23500 zone.. plan your cash trades accordingly
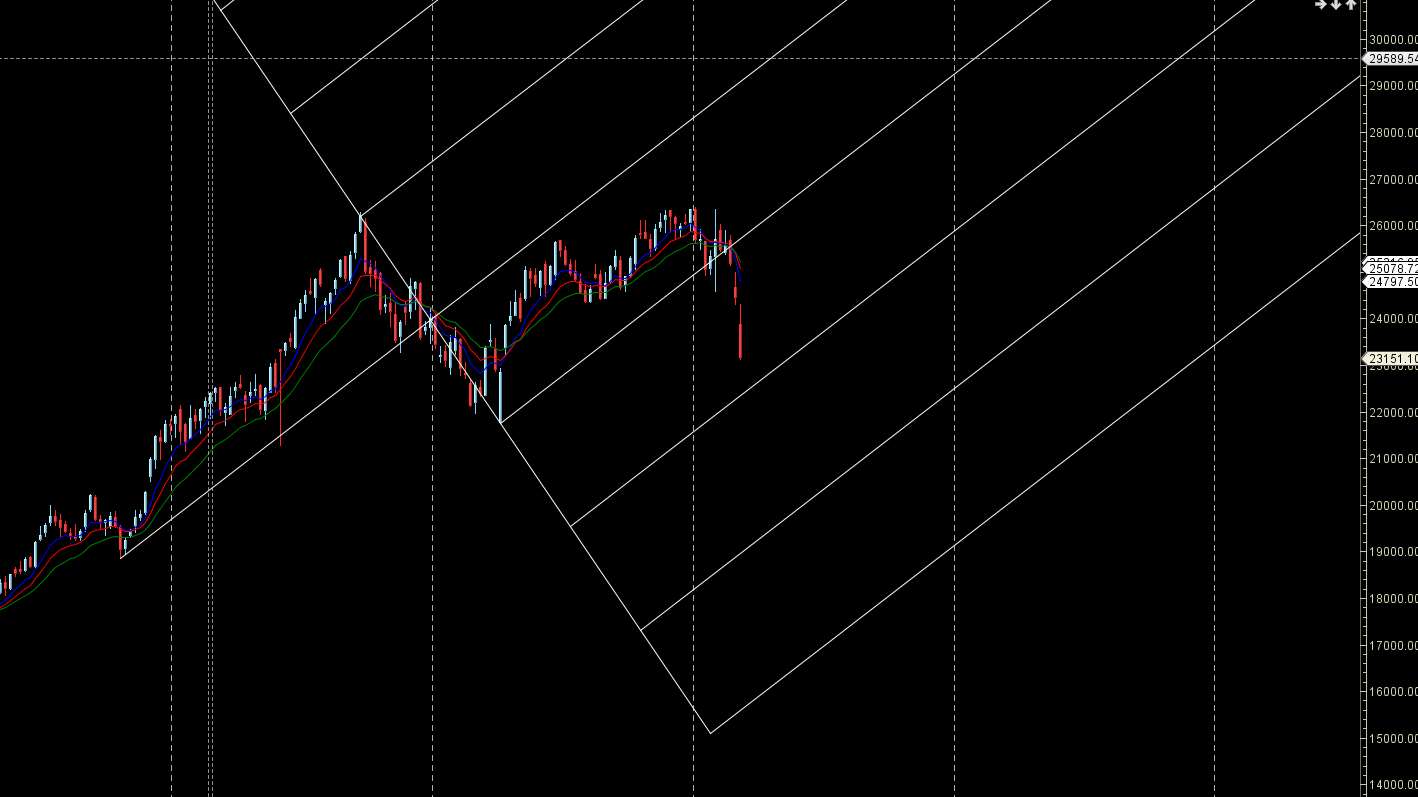
Nifty Gann Angles

Price is back to its 1×4 gann angles support zone.
Nifty Supply and Demand
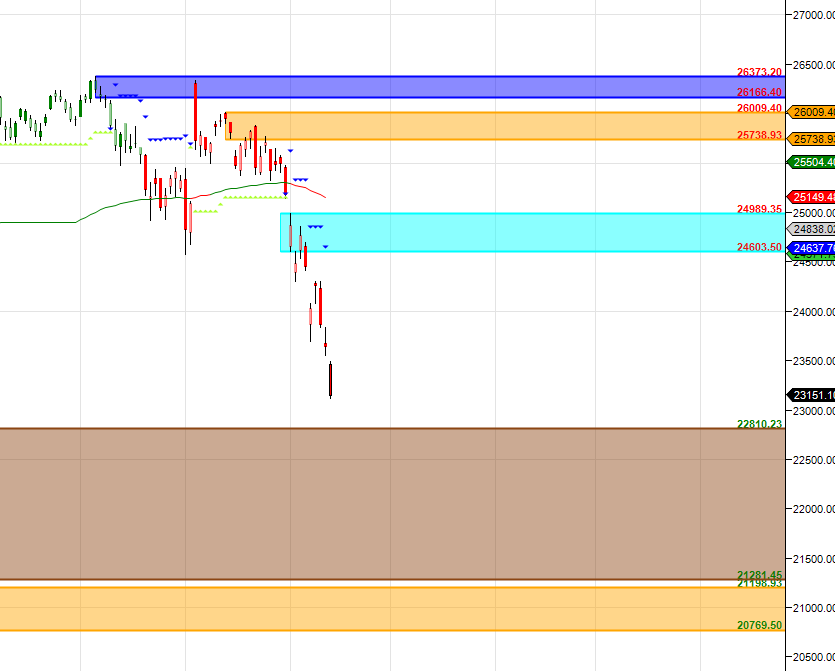
Self Explanatory Chart
Nifty Time Analysis Pressure Dates
Key Pivot Dates: Watch 16/20 March
Nifty Weekly Chart
Price reacted from Weekly AF resistance zone and formed lower low
Nifty Monthly Charts
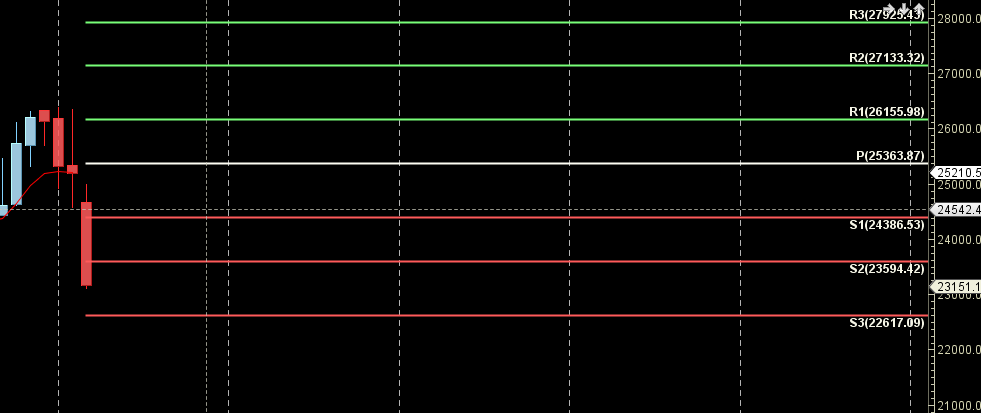
23594 is Monthly resistance zone 22617 is Monthly Support zone.
Nifty Weekly Levels
Nifty Trend Deciding Level: 23215
Nifty Resistance: 23370 23524 23678 23833
Nifty Support: 23061 22906 22752 22598
Levels mentioned are Nifty Spot
As always I wish you maximum health and trading success
Learn More:
W.D. Gann Trading Strategies – Learn how to decode markets using price, time, and geometry.
Trading Using Financial Astrology – Discover how planetary motion impacts market behavior and how to trade it effectively.
Ready to Trade Like a Time-Master?
Join our one-on-one mentorship to master astro-timing, Gann analysis, and institutional-grade setups.
Call: 09985711341
Email: bhandaribrahmesh@gmail.com