


The Illusory Rally: FII Short Covering vs. Retail Trap
The price action on 10 March 2026 presents a classic “Deceptive Bullishness” signature. While the headline figures suggest buying, a deeper forensic audit of the Open Interest (OI) reveals a market built on a fragile foundation. The Nifty may have found support at the Gann 1×2 angle, but the underlying data suggests this bounce is a tactical maneuver rather than a structural trend reversal.
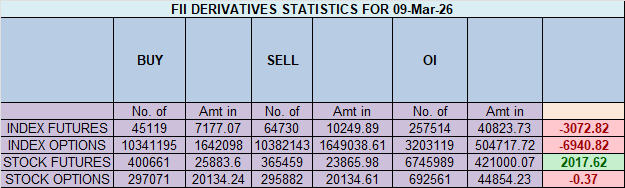
Forensic Breakdown of FII Activity
FIIs were net buyers of 3867 contracts (615 crore), but the “Quality of Buying” is low.
-
The Short Covering Trap: The net OI decreased by 3985 contracts. Crucially, FIIs only added 140 new long contracts while covering 6692 short contracts.
-
Implication: This is not “Fresh Long Accumulation.” FIIs are simply booking profits on their massive short positions to reduce risk ahead of tomorrow’s Mercury Geocentric Speed trigger (Bayer Rule 27). Their Long-Short ratio remains an abysmal 0.14 (12:88), signaling that their dominant bias is poised to remain bearish until the 0.25–0.30 zone is reclaimed.
Client Behavior: The “Hope” Trade
While the “Smart Money” is covering shorts, Retail Clients are aggressively doubling down on the long side.
-
Diverging Paths: Clients added 2924 fresh long contracts, pushing their Long-Short ratio to a dangerously lopsided 1.90 (71:29).
-
The Conflict: Historically, when FIIs are 88% short and Retail is 71% long, the market is poised for a “Pain Trade” that eventually flushes out the retail optimism.
Last Analysis can be read here
The Nifty has delivered a powerful and resounding victory for the bulls, flawlessly executing the bullish reversal scenario laid out in our previous analysis. The market has passed its first critical test with flying colors. Not only did the bulls achieve the primary objective of a close above the crucial 24,150 pivot, but they also successfully defended the final line in the sand. The initial gap-up was followed by a healthy pullback to fill the gap, with the low of 24,079 staying decisively above the bearish breakdown trigger of 24,050.
This price action is a definitive validation of the Hammer reversal pattern. The bears have been defeated at the lows, and a new, more confident bullish trend has now been established. This confirmed technical strength is now being met with two powerful, independent catalysts set to provide a major tailwind for the rally.
1. The Fundamental Rocket Fuel: The Reliance Catalyst
A major, positive, stock-specific news event has entered the picture: a potential collaboration between the Trump organization and Reliance. As the Nifty’s undisputed heavyweight champion, any significant positive news for Reliance acts as a powerful fundamental rocket fuel for the entire index. This is not a subtle, sector-wide influence; it is a direct, brute-force catalyst poised to provide a significant upward bias to the Nifty right from the opening bell.
2. The Sectoral Tailwind: Jupiter Direct and the IT Rebound
Simultaneously, a major astrological shift is set to provide broad-based market support. Jupiter, the planet of expansion and abundance, is turning direct. The astrological reason this is a bullish catalyst is that Jupiter’s direct motion unleashes expansive, “risk-on” energy across the market. As your analysis correctly identifies, this is a major sentiment booster for high-beta sectors, and the focus now shifts squarely to IT stocks. After a period of underperformance, this powerful Jupiterian tailwind makes a rebound in the IT sector a high-probability event, creating a second, powerful engine to support the Nifty’s advance.
The Path Forward: Targeting the Next Resistance
With the bullish reversal now confirmed and two new powerful catalysts providing fuel, the path of least resistance is now definitively upwards. The market’s focus now shifts from defending support to attacking the next major resistance zones. The logical and high-probability objectives for this new rally are:
-
Primary Target Zone: 24,350 – 24,637
The Bullish Thesis Invalidation
Even in a strong bull market, risk must be managed. The entire bullish view is predicated on the successful defense of the recent lows. A catastrophic failure and a decisive close below 24,050 would negate the bullish thesis and signal a major and unexpected reversal of sentiment.
Conclusion
The battle for the bottom is over, and the bulls are in a commanding position. The reversal has been technically confirmed. Now, a powerful fundamental catalyst for the Nifty’s heavyweight (Reliance) is converging with a major cyclical tailwind for its second-largest component (IT). This is a classic setup for a high-momentum, trending move. Prepare for an exciting session where the bulls are poised to press their advantage and attack the next major resistance zones.
Nifty Dec Futures Open Interest Volume stood at 1.74 lakh cr , witnessing addition of 17.4 Lakh contracts. Additionally, the increase in Cost of Carry implies that there was addition of SHORT positions today.
Nifty Advance Decline Ratio at 41:09 and Nifty Rollover Cost is @25628 closed below it.
In the cash segment, Foreign Institutional Investors (FII) sold 4672 cr , while Domestic Institutional Investors (DII) bought 6333 cr
The Nifty options market is signaling a state of extreme bearish control and high-stakes tension. A profoundly negative Put-Call Ratio (PCR) of just 0.73 indicates that the open interest in call options has massively overwhelmed that of puts. This is the unmistakable signature of a market dominated by aggressive call writers, reflecting their high conviction that any attempt at a rally will be brutally suppressed.
This intense bearish pressure has pinned the market exactly at its financial center of gravity, the Max Pain point of 24,150. With the spot price trading at 24,131, the index is perfectly trapped at the point of maximum financial pain for option buyers, confirming the absolute control of large institutional sellers.
A deep dive into the participant data reveals a critical divergence in strategy:
-
Foreign Institutional Investors (FIIs) are acting with clear bearish intent. They are significant net sellers of call options (building the resistance wall) and net buyers of put options (actively purchasing downside insurance). This two-pronged action shows clear institutional conviction that the risk is firmly to the downside.
-
Retail appears to be betting on a breakout, acting as net buyers of both calls and puts, fueling the institutional strategies.
This has forged a clear and formidable battlefield:
-
Resistance: The primary resistance is the “Great Wall of Calls” located at the 24,200 strike, which is also reinforced by the Max Pain level. The next major ceiling is at 24,500.
-
Support: A significant support floor has been built by put writers at 24,000. The ultimate line of defense and psychological support is located at 23,800.
In conclusion, the Nifty is locked in a bear grip, dominated by institutional selling pressure. The market is trapped in a tight, high-tension range, and any relief rally is likely to be sold into aggressively at the 24,150-24,200 zone.
Nifty Spot – Intraday Chart Observation
Technical Setup: The index is approaching critical breakout levels. Watch these zones for price action confirmation:
-
Strength (Upside): Momentum is expected to pick up if Nifty sustains above 24250 . In this scenario, the immediate resistance levels are 24285 24323 and 24377
-
Weakness (Downside): The trend technically weakens if the index slips below 24200 This could open the path towards support levels at 24166, 24108 and 24066.
Wishing you good health and trading success as always.As always, prioritize your health and trade with caution.
As always, it’s essential to closely monitor market movements and make informed decisions based on a well-thought-out trading plan and risk management strategy. Market conditions can change rapidly, and it’s crucial to be adaptable and cautious in your approach.
► Join Youtube channel : Click here
► Check out Gann Course Details: W.D. Gann Trading Strategies
► Check out Financial Astrology Course Details: Trading Using Financial Astrology
► Check out Gann Astro Indicators Details: Gann Astro Indicators