


Conflict Escalates: FIIs Build Bearish Wall as New Money Enters the Battle
On the surface, the activity in the Bank Nifty Index Futures on March 9, 2026, appeared to be a modest continuation of the bearish sentiment, with Foreign Institutional Investors (FIIs) shorting a net 855 contracts. However, the session’s most powerful and telling signal reveals a far more complex and explosive story: the net Open Interest (OI) surged by a massive 2,455 contracts.
This is a profoundly important development. It indicates that the market is not simply drifting lower on weak sentiment. Instead, a new, high-stakes battle is actively being initiated, with fresh, high-conviction capital pouring in from both sides.
Decoding the Data: The Signature of a Building Conflict
The key to understanding this market is the dramatic divergence between the FII action and the much larger growth in total participation.
-
The FII Bears: Methodically Building a Wall of Resistance: The FIIs’ action is one of cold, calculated conviction. They are using the current price levels not to exit, but to methodically build a larger short position. This continuous selling pressure is designed to create a formidable supply wall, acting as a major resistance to any potential rally.
-
The OI Surge: New Bulls Enter the Arena: For Open Interest to expand by nearly three times the FII net shorting, it means a powerful new wave of buyers has entered the market. These are new, confident bulls initiating fresh long positions, willingly and aggressively absorbing the entire supply from the institutional sellers and forcing the creation of brand-new contracts. This is a head-on collision.
Key Implications:
-
Imminent Expansion in Volatility: A market where new longs and new shorts are aggressively building positions is a market building potential energy. The current stalemate is under immense pressure and is poised to be resolved by a high-velocity breakout or breakdown.
-
A High-Conviction Standoff: This is not a market of indecision. Both sides are so convicted in their opposing views that they are willing to put significant new money to work.
-
The “Calm Before the Storm”: The quiet, range-bound price action is profoundly deceptive. The real story is the massive buildup of positions beneath the surface, priming the market for its next major, directional trend.
Conclusion: Disregard the modest FII headline number. The crucial takeaway is the explosive growth in Open Interest, which is the market’s definitive proof that a major new conflict has begun. The Bank Nifty is no longer in a simple downtrend; it is now in a high-tension consolidation phase, coiling for a significant and powerful resolution.
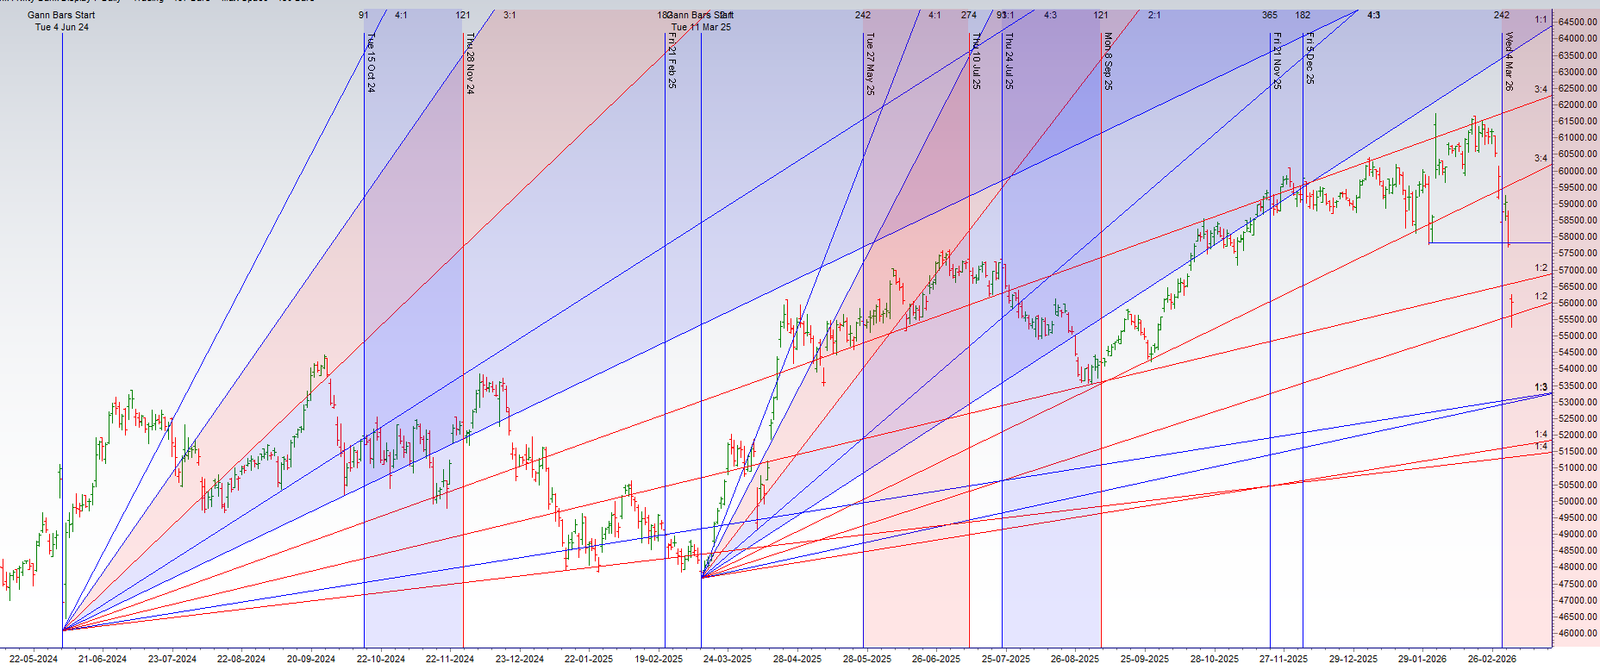
The Bank Nifty has just delivered a stunning and powerful validation of our astro-technical model. A huge gap down opening, driven by intense fear, brought the price crashing down to the 1×2 Gann angle support. From a purely technical perspective, this was a moment of maximum bearishness.
However, this technical breakdown collided with two of the most powerful and historically reliable astrological catalysts for a major bottom.
-
Bayer Rule 27: This potent rule, which flags “big major bottoms” when Mercury’s speed reaches a specific extreme, was perfectly timed.
-
The Lunar Eclipse Date: This second major cyclical turning point amplified the bottoming signal.
The catalyst for the reversal was this perfect confluence of “price-time” events. The bearish capitulation (the gap down) occurred precisely at the moment of a pre-calculated cyclical turning point, and as confirmed by your analysis, the price never broke its first 15-minute low, the definitive tactical signal that a major reversal was underway. The overnight crash in crude oil prices provided the fundamental fuel for the bulls to seize this opportunity, leading to a good recovery.
The Bullish Victory Lap and a Critical New Test
The bulls are now in a position of immense strength. Having successfully defended a major cyclical and technical support, they are set for a big gap up open as short-sellers are forced to capitulate and new buyers rush in. However, this bullish victory lap will immediately carry the market to its next, and most critical, test.
The entire fate of this new nascent rally will be decided by the market’s battle with a single, crucial price level: 56,637.
The Bullish Continuation Scenario
-
The Trigger: A decisive and sustained close above 56,637.
-
The Analysis: A successful close above this level is the definitive signal that the reversal is not just a temporary relief bounce but the beginning of a new, sustainable uptrend. This will validate the major bottom signal and confirm the bulls’ control.
-
The Outcome: This action is poised to trigger a powerful rally back towards the major resistance zone of 57,663.
The Bearish “Bull Trap” Scenario
-
The Trigger: An inability by the bulls to achieve a close above 56,637.
-
The Analysis: A failure to conquer this level is a definitive signal that the powerful recovery was merely a short-covering squeeze and lacked genuine buying conviction. It would turn the entire event into a massive “bull trap.”
-
The Outcome: This failure is poised to trigger a swift reversal and a fall back towards the crucial support level of 55,612.
Conclusion
A major cyclical bottom has been forged in the Bank Nifty. The immediate momentum is powerfully bullish. However, the true test of this new trend’s strength will occur at the critical 56,637 resistance level. The price action here will provide the definitive verdict on whether this is a genuine new bull leg or simply a powerful but ultimately temporary relief rally. Prepare for another pivotal and decisive session.
Bank Nifty Dec Futures Open Interest Volume stood at 18.9 lakh, with addition of 3.4 Lakh contracts. Additionally, the Increase in Cost of Carry implies that there was a addition of SHORT positions.
Bank Nifty Advance Decline Ratio at 00:14 and Bank Nifty Rollover Cost is @61486 closed below it.
The Bank Nifty options market is radiating signals of intense bearish pressure and a market in the firm grip of sellers. A profoundly negative Put-Call Ratio (PCR) of just 0.80 indicates a market overwhelmed by aggressive call writers. This reflects a high degree of confidence among sellers that any recovery attempt will be met with a formidable wall of supply, severely capping the market’s upside potential.
The market has been driven down so aggressively that it is trading far below what was likely its initial structural range. The spot price at 56,019 is now positioned closer to the key support levels, having been decisively rejected from higher levels. This weakness confirms the absolute control of the bears.
The options chain has forged a clear and daunting battlefield for the bulls:
-
Resistance: An immense “Great Wall of Calls” is located at the 56,500 strike, which acts as the immediate and most formidable ceiling. This is the primary line of defense for the bears. The distant Max Pain at 59,000 now represents a former battleground, indicating just how far and fast the market has fallen.
-
Support: On the downside, a massive support floor and the ultimate line of defense for the bulls has been built by put writers at the 55,500 strike.
In conclusion, the Bank Nifty is in a powerful bear grip, dominated by negative sentiment and overwhelming overhead supply. The path of least resistance is firmly to the downside. The market is trapped in a well-defined range between the massive support at 55,500 and the immense resistance at 56,500. A major catalyst will be required to break this deadlock.
Bank Nifty Spot – Intraday Technical Setup
Market Observation: The index is currently trading within a defined range. Traders should watch the following pivot zones for potential directional moves:
-
Strength (Upside): If the index sustains above 56439 , it indicates bullish momentum. The immediate resistance levels to watch are 56666 56858 59119 .
-
Weakness (Downside): Selling pressure is likely to intensify if the index breaks below 56225 . In this scenario, the next support zones are 56108 55937 55772 .
Wishing you good health and trading success as always.As always, prioritize your health and trade with caution.
As always, it’s essential to closely monitor market movements and make informed decisions based on a well-thought-out trading plan and risk management strategy. Market conditions can change rapidly, and it’s crucial to be adaptable and cautious in your approach.
► Join Youtube channel : Click here
► Check out Gann Course Details: W.D. Gann Trading Strategies
► Check out Financial Astrology Course Details: Trading Using Financial Astrology
► Check out Gann Astro Indicators Details: Gann Astro Indicators