


Disclaimer
This analysis represents the highest-probability forecast derived from expert, multi-decade historical evaluation of astrological signatures and their documented correlation with market psychology and price action.
No Guarantee
This is not a guarantee of future market performance. Financial markets are influenced by numerous dynamic and unpredictable real-world factors. All trading and investment activities carry significant risk, including the potential loss of principal.
Educational Purpose Only
This content is strictly for informational and educational purposes and should not be construed as financial advice or a recommendation to buy, sell, or trade any financial instrument.
Consult a Professional
We strongly advise you to consult a qualified financial advisor before making any investment decisions. Any actions you take based on this analysis are solely your responsibility. We assume no liability for any financial profits or losses that may occur.
Theme for Sensex: The Geopolitical Shakeout & The Jupiter Reversal
The theme for the Sensex is a classic “fear-driven washout” leading to a technically significant reversal from a major cycle low. The geopolitical shock and high crude prices provide the fundamental catalyst for an immediate breakdown at the week’s open, a move that will be amplified by the volatility signals from early-week Bayer Rules. The script for the first two days is a high-velocity decline. The narrative flips entirely on Wednesday. The Jupiter Direct station is the designated pivot, a moment of peak pessimism that is set to form the capitulation low. IF the Nifty forms a strong reversal pattern at a key support level on this day, THEN it signals the start of a powerful new relief rally. This new trend will be given strong momentum on Friday by the directional energy of the Mars-North Node conjunction.
For a Detailed Day by Day Forecast with Neural Analysis Please watch the below video
SENSEX Harmonic Pattern
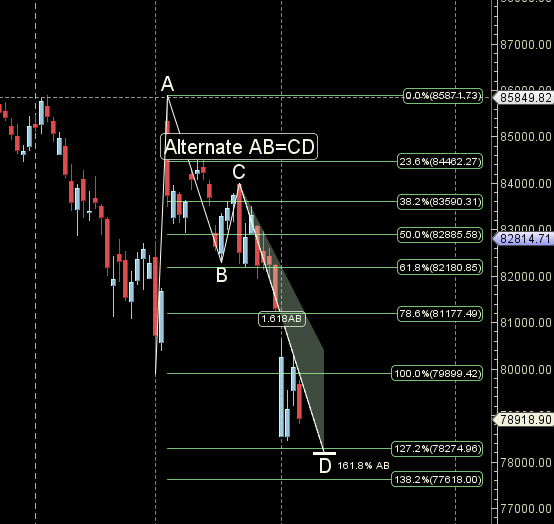
Sensex is approaching its PRZ zone at 78300-78500.
SENSEX Gann Angles
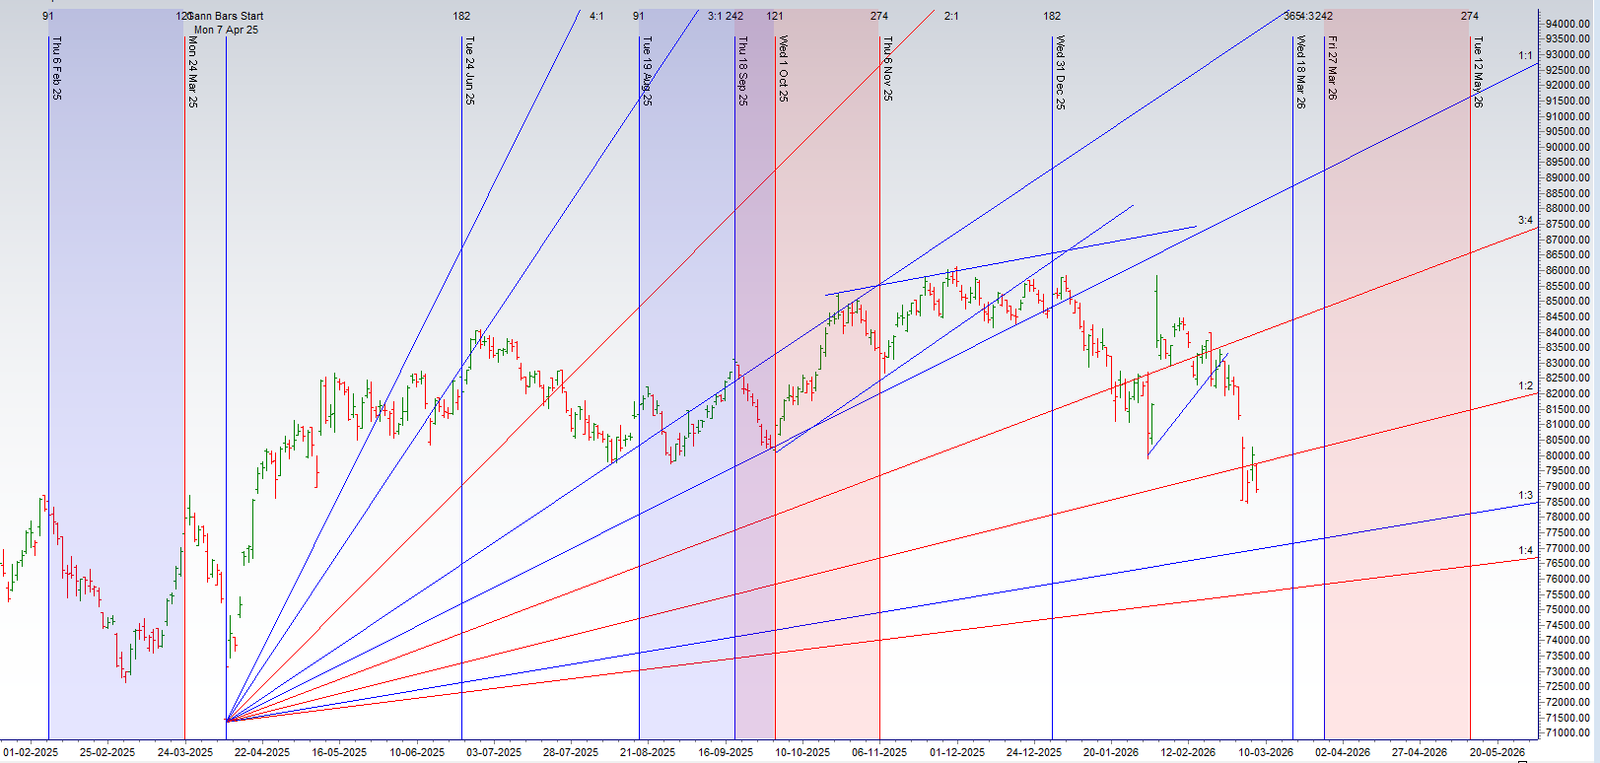
Sensex has broken its 1×2 gann angle
SENSEX Supply and Demand
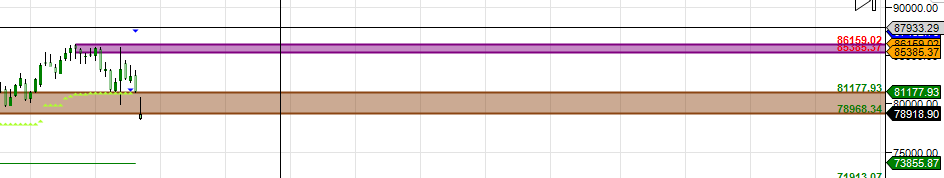
Self Explanatory Chart
SENSEX Time Analysis Pressure Dates
Key Pivot Dates: Watch 09/11 March
SENSEX Weekly Chart
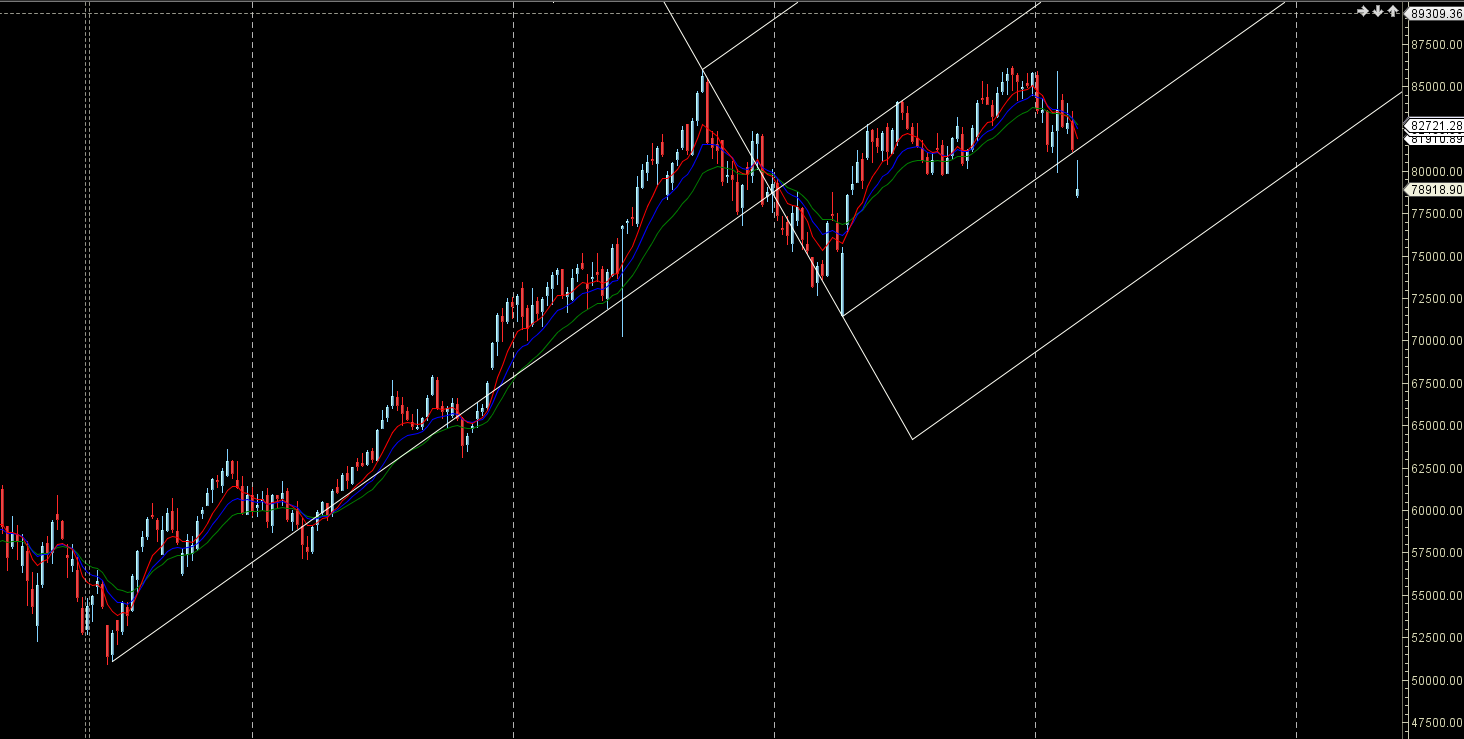
Price corrected from weekly resistance zone.
SENSEX Monthly Charts
82352 is Monthly resistance zone 78500 is Support zone.
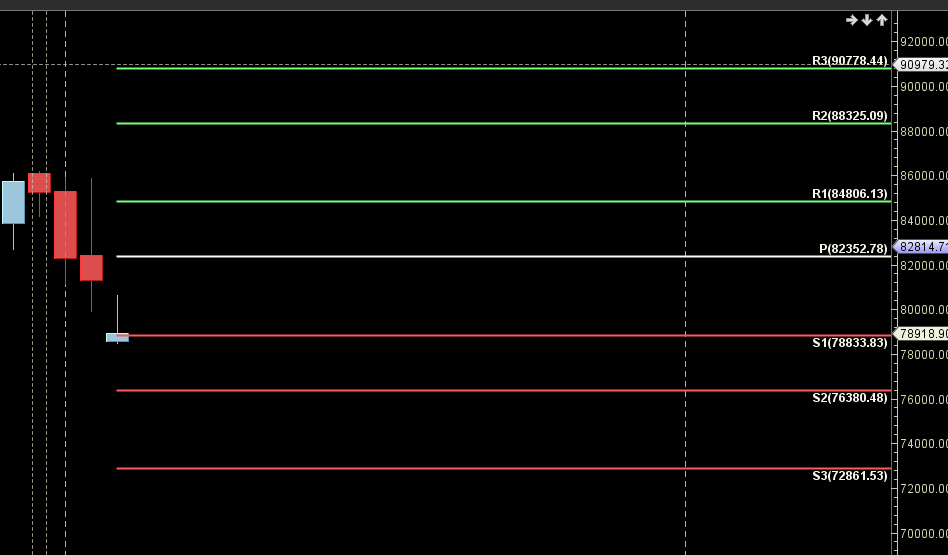
SENSEX Weekly Levels
SENSEX Trend Deciding Level: 78623
SENSEX Resistance: 78905 79188 79471 79753
SENSEX Support: 78341 78058 77776 77493
Levels mentioned are SENSEX Spot
Learn More:
W.D. Gann Trading Strategies – Learn how to decode markets using price, time, and geometry.
Trading Using Financial Astrology – Discover how planetary motion impacts market behavior and how to trade it effectively.
Ready to Trade Like a Time-Master?
Join our one-on-one mentorship to master astro-timing, Gann analysis, and institutional-grade setups.
Call: 09985711341
Email: bhandaribrahmesh@gmail.com