


A Declaration of War: FIIs Unleash Historic Bearish Assault Against a Tidal Wave of Retail Buying
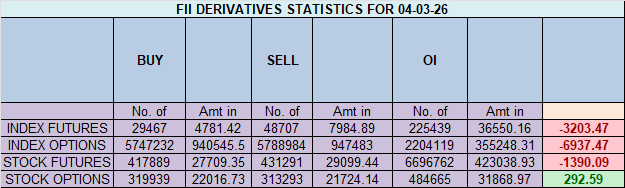
On March 4, 2026, the Nifty Index Futures market transformed into a historic battlefield of epic proportions. Foreign Institutional Investors (FIIs) did not just lean bearish; they launched a full-scale, strategic “shock and awe” campaign, creating an unprecedented 15,313 new short contracts and liquidating a huge portion of their long book, resulting in a colossal net short position for the day of 13,258 contracts.
This institutional onslaught of historic proportions was met with a breathtakingly defiant and equally massive wave of buying from retail clients. This direct, head-on collision resulted in one of the largest single-day expansions of net Open Interest (OI) on record, which surged by a staggering 11,688 contracts. This is the definitive signature of a market on the verge of all-out war.
Decoding the Data: Two Armies with Absolute, Opposing Convictions
This data reveals a market stretched to its absolute breaking point by one of the most extreme divergences between institutional and retail sentiment ever recorded. The massive OI surge is irrefutable proof that this is a conflict being fueled by a colossal infusion of new, high-conviction capital on both sides.
1. The FII “All-In” Bearish Assault:
The FIIs’ actions were a testament to maximum possible bearish conviction. Their strategy was surgical and brutal:
-
Their creation of over 15,000 new shorts is an immense, aggressive bet that a significant market top is in place and a crash is imminent.
-
Simultaneously, they dumped over 4,000 long contracts, a powerful two-pronged attack signaling a complete abandonment of any bullish scenario.
-
This has cemented their positioning at an extreme 16% long versus 84% short (ratio 0.15), a clear, institutional bet on a significant decline.
2. The Client: A Market Divided, A Battle Joined
In a stunning display of activity, the retail clients met the institutional onslaught on both fronts, adding a combined 30,000 new contracts to the market’s total open interest.
-
The Bullish Army: One massive group added a colossal 21,139 new long contracts, willingly and fearlessly absorbing the institutional supply and betting on a continued rally.
-
The Bearish Contingent: Another, also huge group, added 9,189 new short contracts, joining the FIIs in betting on a decline.
-
This leaves their legacy positioning at a highly bullish 73:27.
This internal fracturing, happening at a point of peak FII bearishness, is a sign of extreme market chaos and polarization.
Key Implications for the Market
-
A Historic Powder Keg: The market is now at a point of maximum possible tension. A situation where institutions are at peak bearishness, retail is still fundamentally bullish but also joining the short side in a panic, and all backed by a colossal surge of new money, is fundamentally unstable and cannot last.
-
An Explosion in Volatility is Now a Certainty: The resolution to this extreme conflict will not be a gentle drift. It will be a violent, high-velocity price shock designed to force one side into a catastrophic capitulation.
-
The Ultimate Contrarian “Red Alert” is Blaring: This is a textbook “smart money vs. retail money” setup at its most extreme.
-
The “Pain Trade” is Obvious: The path of maximum financial pain is a sharp decline that would trigger a devastating liquidation cascade from the massive base of retail longs.
Conclusion
Disregard any small, choppy price movements. The only story that matters is the colossal, unsustainable buildup of opposing forces, confirmed by the historic surge in Open Interest. The FIIs have declared all-out war on this market rally. This is not a trending market; it is a battlefield primed for a climactic and decisive event. A major, violent resolution is now a matter of “when,” not “if.”
Last Analysis can be read here
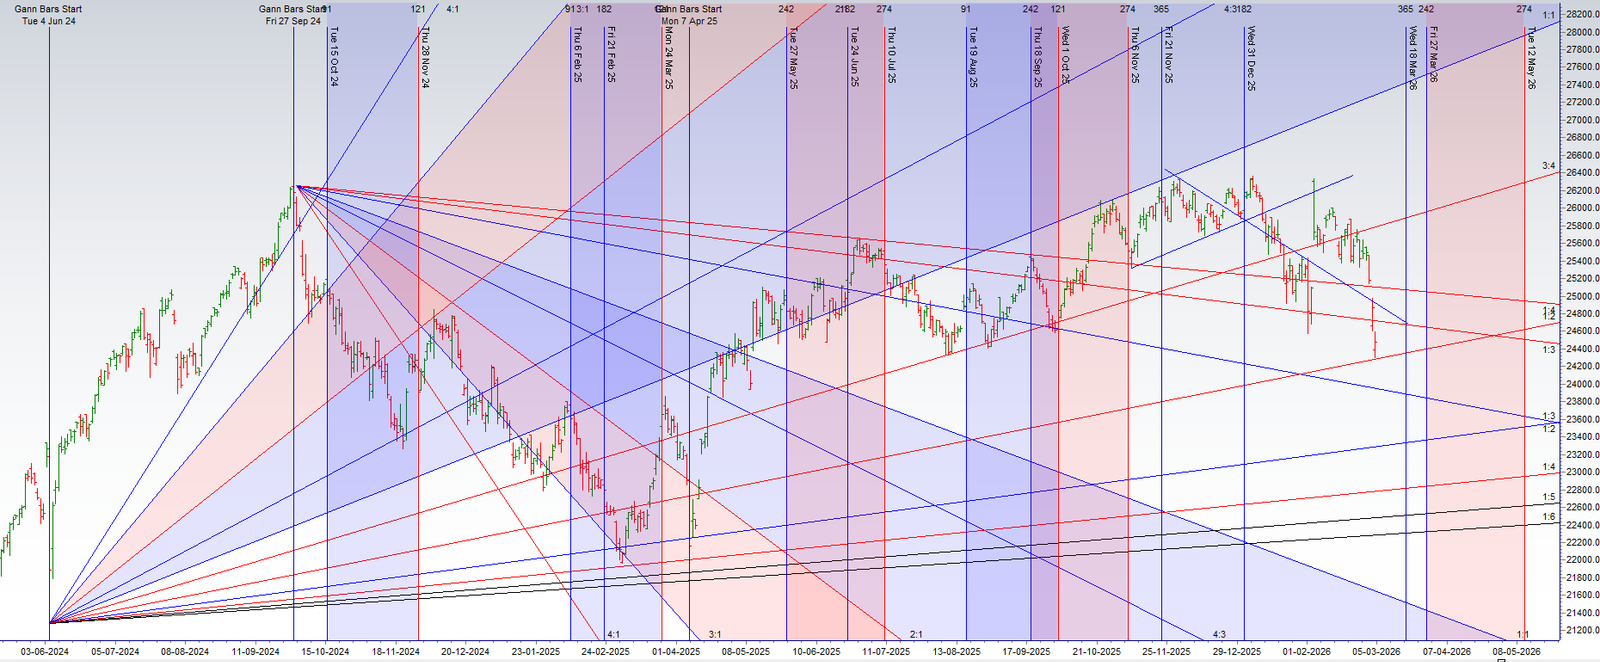
The Nifty 50 has reached a critical junction where mathematical precision meets cosmic timing. Following a significant gap down that rattled weak hands, the index staged a disciplined recovery, finding a “perfect low” at the Gann 1×2 Angle. This was not a random bounce; it was a structural defense of the 24,389 pivot, signaling that the bulls are prepared to fight for this territory.
The Geocentric Fuse: Bayer’s Rule 27
As we head into tomorrow’s session, the technical setup is being supercharged by Bayer’s Rule 27. Historically, major trend reversals—both tops and bottoms—coincide with Mercury’s geocentric longitude speed reaching 59 minutes or 1 degree 58 minutes. We are currently entering this precise window. When Gann price levels align with such potent astronomical triggers, the resulting moves are rarely subtle; they are explosive.
The Battle Plan: Levels of Conviction
For this relief rally to transform from a “dead cat bounce” into a sustained recovery, the following technical milestones must be cleared:
-
The 15-Minute Litmus Test: The first 15 minutes of trade will set the tone. A breakout above the opening 15-minute high is your first signal of intent.
-
The Budget Pivot: The ultimate “line in the sand” is 24,571 (the Budget Day Low). A decisive close above this level within the first hour of trading would confirm that the smart money is absorbing the supply.
-
The Targets: If 24,571 is reclaimed, expect a rapid extension toward 24,666 and 24,729. The ultimate destination for this leg of the journey remains the 1×3 Gann Angle at 24,792, which will act as a massive gravity well for the price.
The Verdict: We are at a “Change of Trend” doorstep. While the gap down looked bearish on the surface, the defense of the 1×2 angle suggests a trap is being set for late shorters. Watch the 24,571 level with absolute focus—it is the gateway to the 24,792 target.
Nifty Dec Futures Open Interest Volume stood at 1.56 lakh cr , witnessing addition of 6.7 Lakh contracts. Additionally, the increase in Cost of Carry implies that there was addition of SHORT positions today.
Nifty Advance Decline Ratio at 08:42 and Nifty Rollover Cost is @25628 closed below it.
In the cash segment, Foreign Institutional Investors (FII) sold 8752 cr , while Domestic Institutional Investors (DII) bought 12068 cr
Nifty Derivatives Analysis: Bearish Sentiment Prevails
The Nifty 50 currently exhibits a cautious to bearish undertone based on the latest derivatives data. With the Current Market Price (CMP) at 24,480.70, the index is trading below its key psychological levels, and the option chain structures suggest that the bulls are currently on the backfoot.
PCR and Open Interest (OI) Dynamics
The Put-Call Ratio (PCR) of 0.78 is a primary indicator of bearish sentiment. A PCR below 1.0 typically signifies that Call writing is outpacing Put writing. With 948.51 Lakh Call OI against 747.01 Lakh Put OI, the “heavy” overhead supply from Call sellers is likely to cap any immediate upside. The Max Pain level at 24,700 is notably higher than the CMP, suggesting that while the market is currently depressed, the point of maximum expiration discomfort for option buyers sits roughly 220 points above the current price.
Key Support and Resistance Levels
The Option Chain reveals a defined trading range, though the immediate bias remains skewed toward the resistance zones:
-
Key Resistance (Highest Call OI): 24,800. This serves as a formidable ceiling. For a trend reversal, Nifty needs a decisive daily close above this level.
-
Key Support (Highest Put OI): 24,300. This is the immediate floor. A breach below 24,300 could trigger a fresh round of long unwinding, potentially dragging the index toward 24,150.
-
Immediate Hurdle: 24,500–24,600 acts as a tactical resistance zone where Call writers are likely active given the CMP.
Participant Activity: Retail vs. FIIs
There is a clear divergence in market participation. Retail traders are aggressively expanding their footprint, adding significantly more Call contracts (over 700K combined) compared to Put contracts (roughly 500K). This “long-heavy” retail bias often acts as a contrarian indicator, suggesting the market may remain under pressure.
In contrast, FIIs (Foreign Institutional Investors) remain relatively conservative but balanced, adding roughly 219K Call contracts and 161K Put contracts. Their activity shows a slight preference for the upside, but not enough to counteract the massive Call writing observed in the overall OI.
Conclusion: Given the PCR of 0.78 and heavy Call OI at 24,800, the short-term outlook remains “Sell on Rise” until the index sustains above 24,600.
Nifty Spot – Intraday Chart Observation
Technical Setup: The index is approaching critical breakout levels. Watch these zones for price action confirmation:
-
Strength (Upside): Momentum is expected to pick up if Nifty sustains above 24525 . In this scenario, the immediate resistance levels are 24571 24624 and 24699
-
Weakness (Downside): The trend technically weakens if the index slips below 24444 This could open the path towards support levels at 24400, 24333 and 24276 .
Wishing you good health and trading success as always.As always, prioritize your health and trade with caution.
As always, it’s essential to closely monitor market movements and make informed decisions based on a well-thought-out trading plan and risk management strategy. Market conditions can change rapidly, and it’s crucial to be adaptable and cautious in your approach.
► Join Youtube channel : Click here
► Check out Gann Course Details: W.D. Gann Trading Strategies
► Check out Financial Astrology Course Details: Trading Using Financial Astrology
► Check out Gann Astro Indicators Details: Gann Astro Indicators