


A Declaration of War: FIIs Unleash Historic Bearish Assault Against an Unprecedented Retail Onslaught
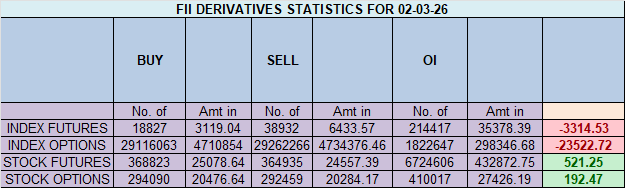
On March 2, 2026, the Nifty Index Futures market transformed into a historic battlefield. Foreign Institutional Investors (FIIs) did not just lean bearish; they launched a full-scale, strategic assault, creating an unprecedented 18,794 new short contracts, resulting in a colossal net short position for the day of 16,094 contracts.
This institutional “shock and awe” campaign was met with a breathtakingly defiant and equally powerful wave of buying and selling from retail clients. This head-on collision resulted in one of the largest single-day expansions of net Open Interest (OI) on record, which surged by a staggering 15,030 contracts. This is the ultimate signature of a market at its breaking point—a massive, unstable buildup of potential energy that is preparing to unleash itself in a violent, directional move.
Decoding the Data: Two Armies at a Point of Maximum Polarization
This data reveals a market at one of its most extreme and dangerous points of divergence. The massive OI surge is irrefutable proof that this is a conflict being fueled by a massive infusion of new, high-conviction capital on both sides.
1. The FII “All-In” Bearish Fortress:
The FIIs’ actions were a testament to maximum bearish conviction.
-
Their creation of nearly 19,000 new shorts is an immense, aggressive bet that a significant market top is in place.
-
Simultaneously, they liquidated a significant portion of their remaining longs, a powerful two-pronged attack.
-
This has cemented their positioning at an extreme 16% long versus 84% short (ratio 0.19), a clear, institutional bet on a significant market decline.
2. The Client: A Market Divided, A Battle Joined
In a stunning display of activity, the retail clients met the institutional onslaught on both fronts.
-
The Bullish Army: One massive group added a colossal 16,695 new long contracts, willingly and fearlessly absorbing the institutional supply.
-
The Bearish Contingent: Another, also huge group, added 13,381 new short contracts, joining the FIIs in betting on a decline.
-
This has left their legacy positioning at a highly bullish 66:34.
This internal fracturing, happening at a point of peak FII bearishness, is a sign of extreme market chaos and uncertainty among retail participants.
Key Implications for the Market
-
A Historic Powder Keg: The market is now at a point of maximum possible tension. A situation where institutions are at peak bearishness, retail is still fundamentally bullish but also joining the short side in a panic, and all backed by a colossal surge of new money, is fundamentally unstable and cannot last.
-
An Explosion in Volatility is Now a Certainty: The resolution to this extreme conflict will not be a gentle drift. It will be a violent, high-velocity price shock designed to force one side into a catastrophic capitulation.
-
The Ultimate Contrarian “Red Alert” is Blaring: This is a textbook “smart money vs. retail money” setup at its most extreme. When positioning becomes this polarized and backed by such huge new bets, history shows the institutions are overwhelmingly on the correct side of the impending move.
-
The “Pain Trade” is Obvious: The path of maximum financial pain is a sharp decline that would trigger a devastating liquidation cascade from the massive base of retail longs.
Conclusion
Disregard any small, choppy price movements. The only story that matters is the colossal, unsustainable buildup of opposing forces, confirmed by the historic surge in Open Interest. The FIIs have declared all-out war on this market rally. The market is no longer a trending environment; it is a battlefield primed for a climactic and decisive event. A major, violent resolution is now a matter of “when,” not “if.”
Last Analysis can be read here
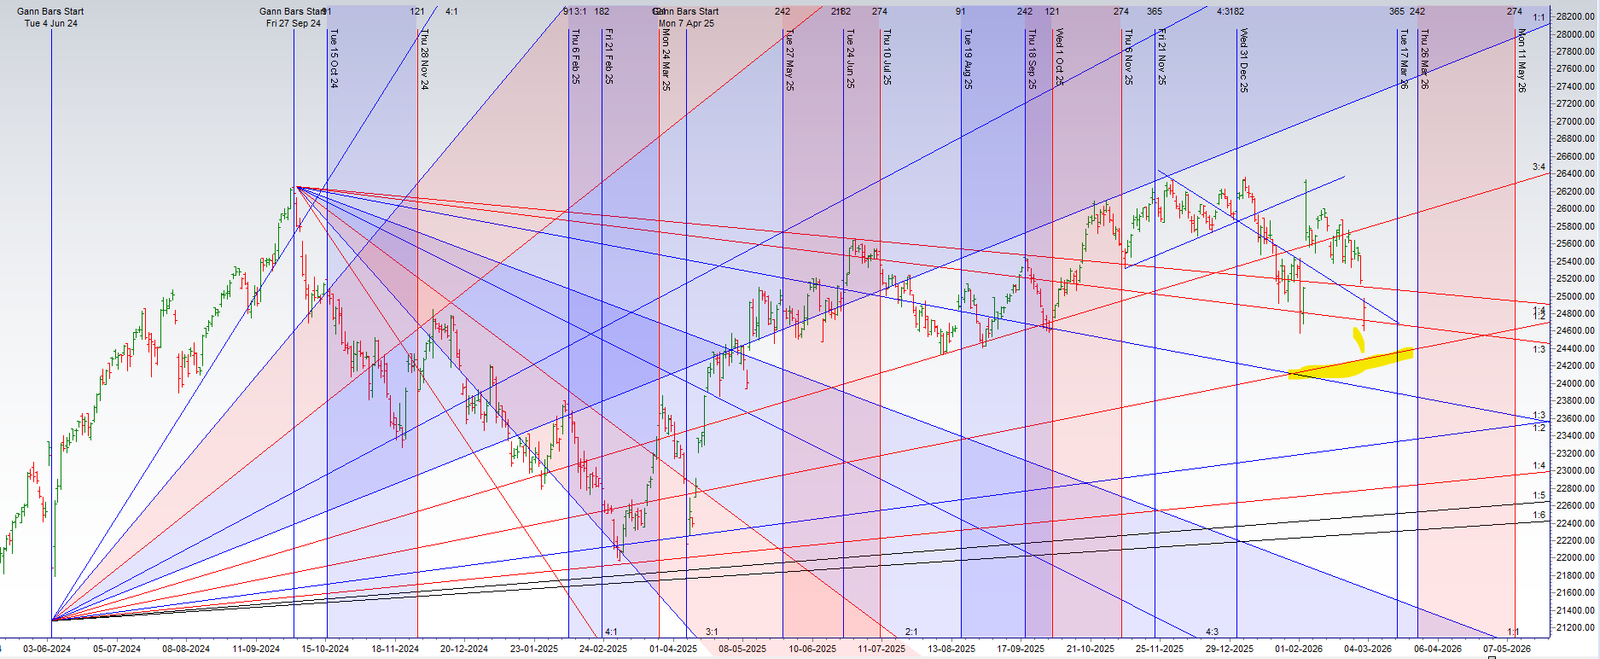
The Nifty is poised to open at a point of maximum conflict and opportunity. A gap-down opening, dictated by overnight cues, signals immediate technical weakness. However, this bearish price action is colliding directly with one of the most historically reliable astrological catalysts for a trend reversal: a Lunar Eclipse. This powerful “price-time” event creates a classic and high-stakes setup where a moment of peak bearish sentiment is met with a pre-calculated cyclical turning point.
1. The Bullish Catalyst: The Lunar Eclipse Reversal
The astrological reason for the potential reversal is clear: a Lunar Eclipse represents a point of emotional culmination and trend exhaustion. The catalyst for the reversal is the eclipse itself because it marks a moment of peak negativity (the gap-down), which is often the very point where selling pressure is exhausted, triggering a psychological reset and allowing a powerful new trend to be born from the ashes of the old one. Your historical research validating that the market tends to rally from this event provides the high-conviction foundation for this analysis.
2. The Battle for Control: Reclaiming the 24,389 Fortress
The entire fate of today’s session, and potentially the entire weekly trend, is poised to be decided by the market’s battle with a single, critical price level. The gap-down will open the market below this level, making the bulls’ primary mission one of reclamation.
The Bullish Scenario: The Gap-Fill and Reversal
-
The Trigger: A decisive and sustained reclaim of the 24,389 pivot.
-
The Analysis: A successful reclaim of this pivot is the definitive signal that the bullish power of the Lunar Eclipse is overwhelming the bearish technical pressure from the gap. This validates the reversal thesis and is poised to trap the early morning short-sellers. This action is poised to trigger a powerful rally back towards the major psychological level of 25,000.
The Bearish Scenario: The Failed Rally
-
The Trigger: A failure by the bulls to reclaim the 24,389 fortress.
-
The Analysis: IF the market attempts to rally but is decisively rejected from the 24,389 zone, it is a definitive signal that the bearish gap pressure is the dominant force. The bullish reversal attempt will have failed, confirming the downtrend. This rejection is poised to trigger a swift decline towards the support level of 24,004.
3. The Intraday Tactical Plan
On a day with such high potential for a violent reversal, a clear, unbiased tactical plan is mandatory.
-
The Trigger: The first 15 minutes’ high and low will act as the definitive line in the sand.
-
The Analysis: A break above the 15-minute high is the definitive confirmation that the bullish eclipse energy is in control and the gap-fill rally is underway. Conversely, a break below the 15-minute low signals that the bearish gap pressure is overwhelming the cyclical catalyst, and the downtrend is set to continue.
Conclusion
The stage is set for a classic battle between a bearish technical opening and a powerfully bullish historical cycle. The ultimate verdict will be delivered at the pivotal 24,389 level. This is not a day for passive observation; it is a day for decisive action based on clear, pre-defined levels. Prepare for a high-conviction session where the day’s trend will be born from the battle for control of this critical fulcrum.
Nifty Dec Futures Open Interest Volume stood at 1.5 lakh cr , witnessing addition of 7.6 Lakh contracts. Additionally, the increase in Cost of Carry implies that there was addition of SHORT positions today.
Nifty Advance Decline Ratio at 08:42 and Nifty Rollover Cost is @25628 closed below it.
In the cash segment, Foreign Institutional Investors (FII) sold 3295 cr , while Domestic Institutional Investors (DII) bought 8593 cr
The Nifty options market is radiating a signal of profound bearish control and a significant loss of bullish confidence. A deeply negative Put-Call Ratio (PCR) of just 0.73 indicates that the market is overwhelmed by aggressive call writers who have built a colossal wall of resistance, reflecting their supreme confidence that any attempt at a rally will be brutally suppressed.
This intense bearish pressure has pushed the market decisively below its financial center of gravity, the Max Pain point of 25,000. With the spot price trading significantly lower at 24,865, the index is in a position of extreme technical weakness. This is a powerful signal that the bears have not just contained the market but have successfully forced it into a new, lower trading range below the point of maximum financial pain for option buyers.
The options chain clearly defines this new, high-stakes battlefield:
-
Resistance: The 25,000 psychological level now serves a dual role as both the Max Pain point and the Key Resistance, holding the highest concentration of Call Open Interest. This has transformed it into a formidable fortress that will be incredibly difficult for bulls to reclaim.
-
Support: On the downside, a massive support floor and the ultimate line of defense for the bulls has been built by put writers at the 24,500 strike.
In conclusion, the Nifty is in a firm bear grip, dominated by negative sentiment and overwhelming overhead supply. The path of least resistance is firmly to the downside. The market is now trapped in a well-defined range between the massive support at 24,500 and the immense resistance fortress at 25,000.
Nifty Spot – Intraday Chart Observation
Technical Setup: The index is approaching critical breakout levels. Watch these zones for price action confirmation:
-
Strength (Upside): Momentum is expected to pick up if Nifty sustains above 24389 . In this scenario, the immediate resistance levels are 24444,24484 and 24555
-
Weakness (Downside): The trend technically weakens if the index slips below 24323 This could open the path towards support levels at 24300, 24250 and 24196.
Wishing you good health and trading success as always.As always, prioritize your health and trade with caution.
As always, it’s essential to closely monitor market movements and make informed decisions based on a well-thought-out trading plan and risk management strategy. Market conditions can change rapidly, and it’s crucial to be adaptable and cautious in your approach.
► Join Youtube channel : Click here
► Check out Gann Course Details: W.D. Gann Trading Strategies
► Check out Financial Astrology Course Details: Trading Using Financial Astrology
► Check out Gann Astro Indicators Details: Gann Astro Indicators