


Disclaimer
This analysis represents the highest-probability forecast derived from expert, multi-decade historical evaluation of astrological signatures and their documented correlation with market psychology and price action.
No Guarantee
This is not a guarantee of future market performance. Financial markets are influenced by numerous dynamic and unpredictable real-world factors. All trading and investment activities carry significant risk, including the potential loss of principal.
Educational Purpose Only
This content is strictly for informational and educational purposes and should not be construed as financial advice or a recommendation to buy, sell, or trade any financial instrument.
Consult a Professional
We strongly advise you to consult a qualified financial advisor before making any investment decisions. Any actions you take based on this analysis are solely your responsibility. We assume no liability for any financial profits or losses that may occur.
Theme for Nifty & Sensex: The Final Washout and The Eclipse Reversal
The theme for the Nifty is a classic “fear-driven washout” leading to a technically significant reversal from a major cycle low. The geopolitical shock provides the catalyst for an immediate breakdown at the week’s open, a move that will be amplified by Monday’s pre-eclipse volatility. The script for the first two days is a high-velocity decline designed to flush out any remaining bullish positions. The narrative flips entirely on Tuesday afternoon. The Total Lunar Eclipse is the designated pivot, a moment of peak irrational fear that forms the capitulation low. IF the Nifty forms a strong reversal pattern at a key support level on this day, THEN it signals the start of a powerful new relief rally. This rally will be given a strong fundamental tailwind on Thursday by the expansive Sun-Jupiter trine, setting the stage for a strong close to the week.
For a Detailed Day by Day Forecast with Neural Analysis Please watch the below video
Nifty Harmonic Pattern
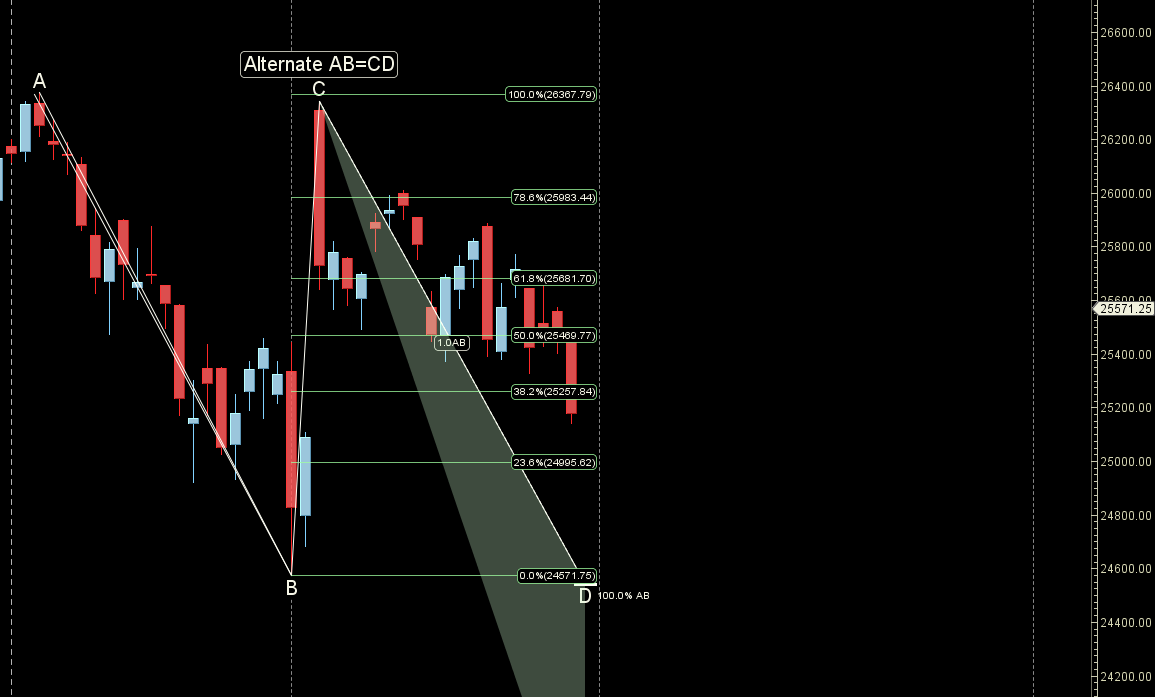
Price is near LOC of 24995 break of it fall towards 24571
Nifty Gann Angles
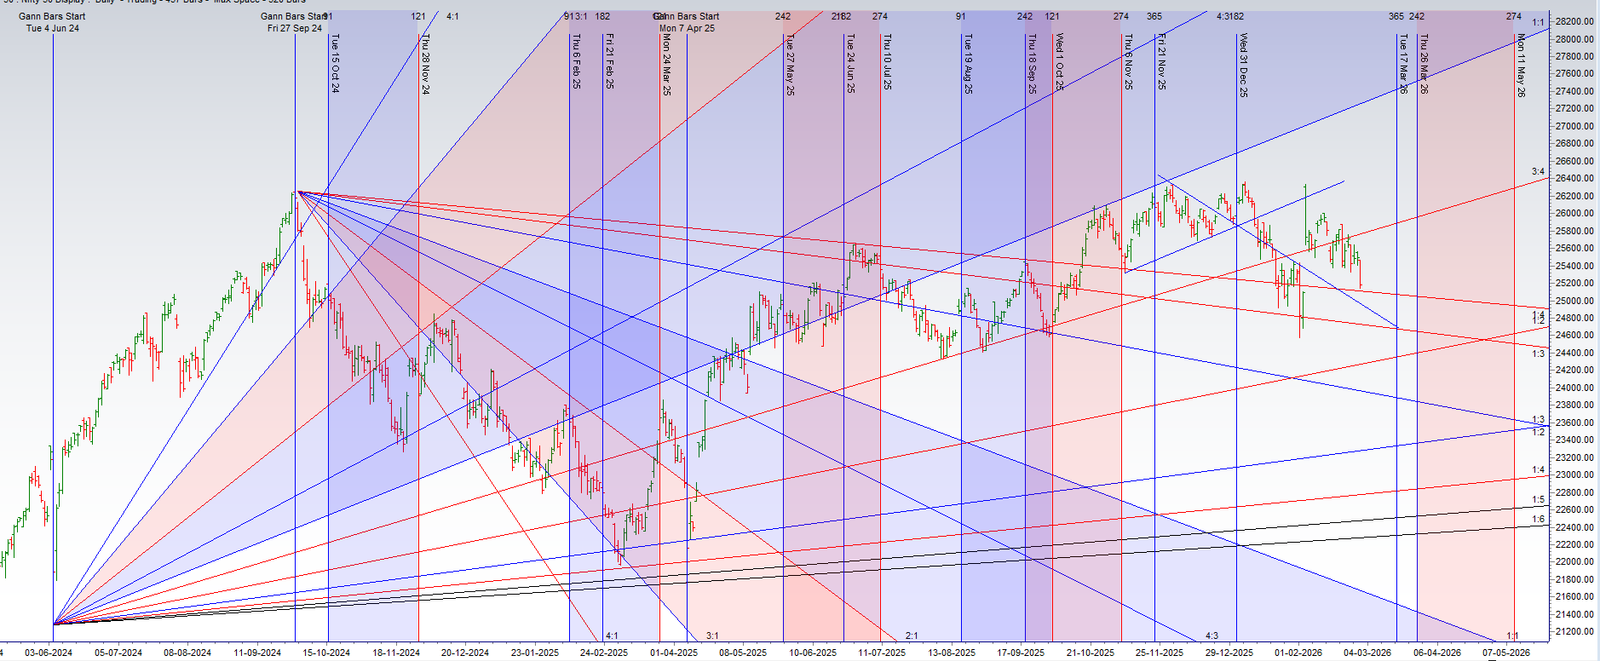
Price is back to its 1×4 gann angles support zone.
Nifty Supply and Demand
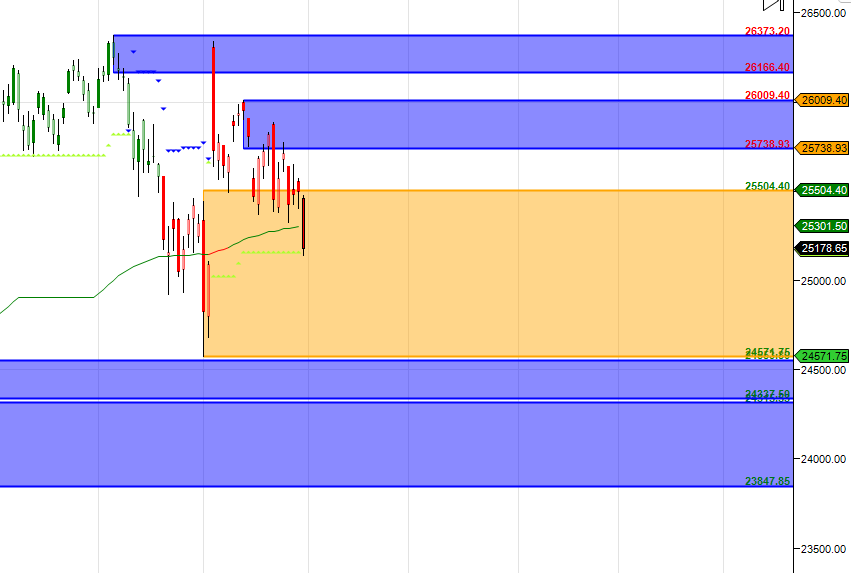
Self Explanatory Chart
Nifty Time Analysis Pressure Dates
Key Pivot Dates: Watch 04 March
Nifty Weekly Chart
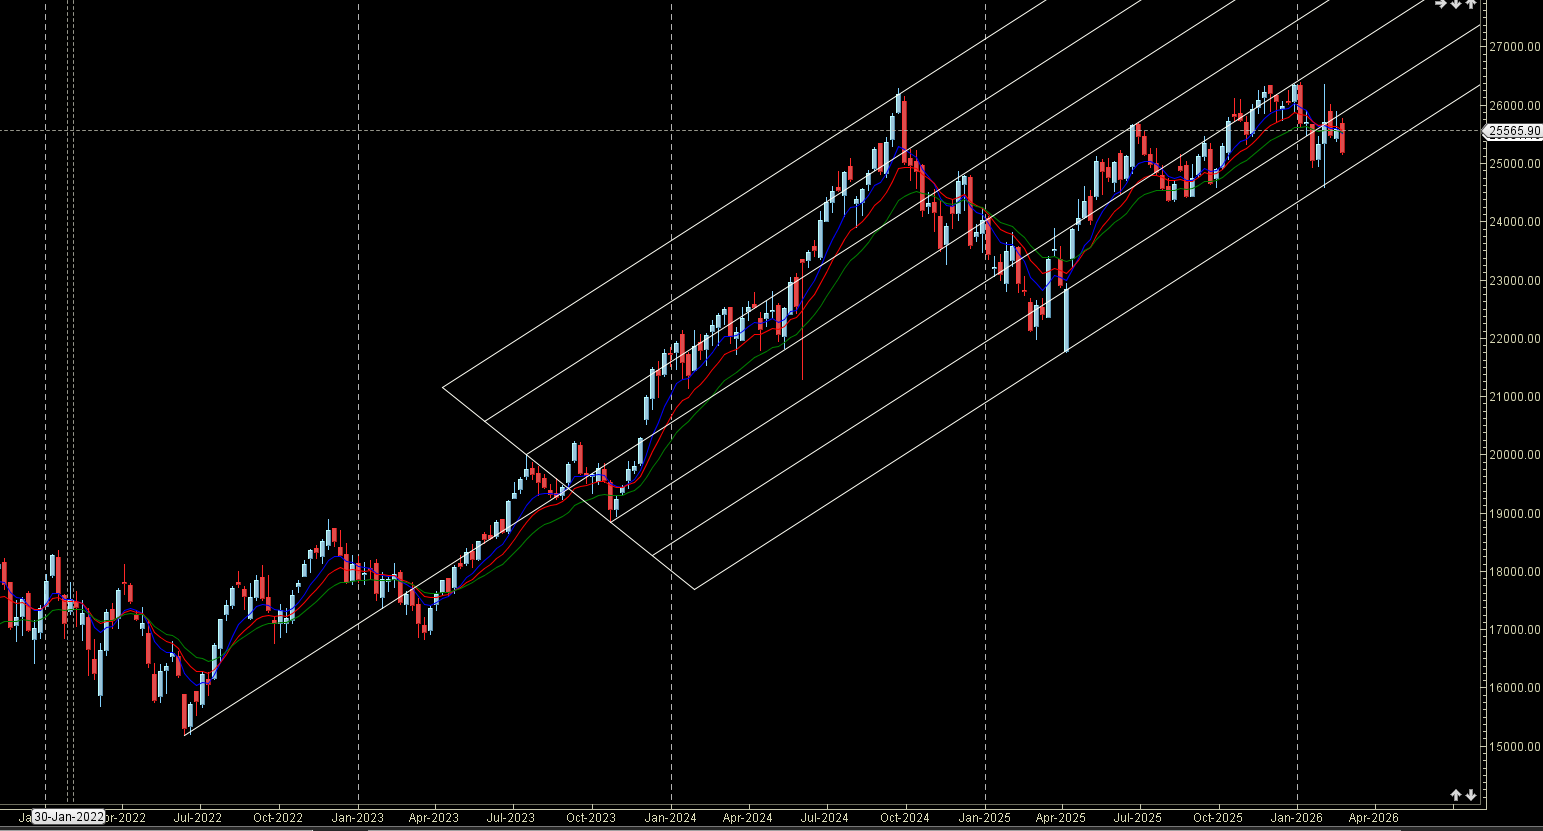
Price reacted from Weekly AF resistance zone and formed lower low
Nifty Monthly Charts
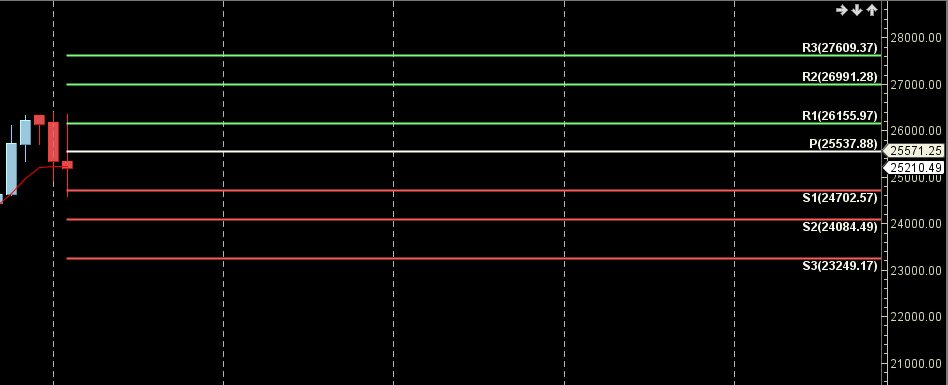
25537 is Monthly resistance zone 24702 is Monthly Support zone.
Nifty Weekly Levels
Nifty Trend Deciding Level: 24949
Nifty Resistance: 25013 25093 25173 25235 25333
Nifty Support: 24870 24791 24712 24632 24553
Levels mentioned are Nifty Spot
As always I wish you maximum health and trading success
Learn More:
W.D. Gann Trading Strategies – Learn how to decode markets using price, time, and geometry.
Trading Using Financial Astrology – Discover how planetary motion impacts market behavior and how to trade it effectively.
Ready to Trade Like a Time-Master?
Join our one-on-one mentorship to master astro-timing, Gann analysis, and institutional-grade setups.
Call: 09985711341
Email: bhandaribrahmesh@gmail.com