


A Tectonic Shift: FIIs Initiate New Bullish Campaign as Market Conflict Brews
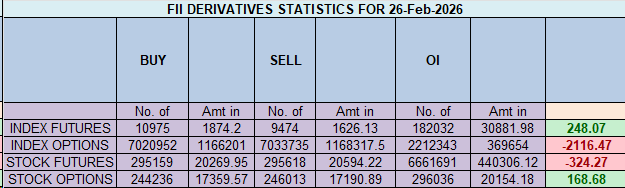
On February 26, 2026, the Nifty Index Futures market gave a subtle but profoundly bullish signal of a major, structural change in market dynamics. While the headline figure showed a modest net buy of 1,587 contracts by Foreign Institutional Investors (FIIs), the true, game-changing story was told by two other numbers: a solid increase in net Open Interest (OI) of 2,179 contracts and the granular breakdown of the FIIs’ own activity.
This was not a session of short-covering or profit-taking. This was the unmistakable signature of the market’s most powerful players beginning to build a brand-new, bullish campaign from the ground up.
Decoding the Data: The Birth of a New Trend
This is a classic and powerful setup that signals the start of a healthy, sustainable trend, driven by a complete institutional pivot.
1. The Main Event: The Great FII Pivot
The most important market event of the day was the FIIs’ granular action. This was not a deceptive buy driven by short-covering.
-
They added 1,544 brand new long contracts.
-
They added a negligible 43 short contracts.
This is pure, one-sided, bullish conviction. This is not an exit strategy; it is an entry strategy. After weeks of holding a massive bearish position, the FIIs are now actively using their capital to initiate new, opposing, bullish bets. This is a tectonic shift. It signals their belief that the market bottom is in and a new, major uptrend is just beginning.
2. The Client: The Bullish Confirmation
For once, the retail clients are not on the opposite side of the FIIs’ active flow. They also showed strong bullish conviction:
-
They added 2,594 new long contracts, providing powerful, broad-based support for the new rally.
This shows that the new uptrend is not a lonely institutional move, but one that is seeing healthy participation from the broader market.
3. The Rising OI: The Market’s “Stamp of Approval”
The significant surge in Open Interest is the definitive proof that this is a high-conviction rally. It confirms that new, committed capital is flooding into the market from both institutional and retail sides to build fresh long positions. A rally on rising OI is a healthy rally. It’s a sign of a broadening trend that is building momentum, not exhausting it.
Key Implications for the Market
-
A New Bullish Trend Has Begun: The FII pivot from shorting/short-covering to initiating new longs is the clearest possible signal that a new, sustainable bull trend is starting.
-
A Powerful Institutional Floor is Being Built: The FIIs’ buying is creating a strong support level under the market. The “buy the dip” mentality is no longer just a retail hope; it is now an institutional strategy.
-
The Paradox of Positioning: The FIIs’ legacy positioning remains deeply bearish (21:79). This means they still have a massive book of old shorts to cover. This creates a powerful dual-engine for the rally: 1) they will be buying to add new longs, and 2) they will eventually be forced to buy to cover their old shorts. This is a powerfully bullish setup.
-
The Path of Least Resistance is Now Firmly Up: The primary institutional flow has turned bullish, and it is being supported by both new retail longs and rising overall participation.
Conclusion
Disregard the still-bearish FII legacy ratio. The only story that matters is their active, new buying. This is a classic institutional pivot, and it signals the birth of a new bull trend. The rising Open Interest is the market’s loud and clear confirmation. A new, healthier, and likely sustainable up-move has just begun.
Last Analysis can be read here
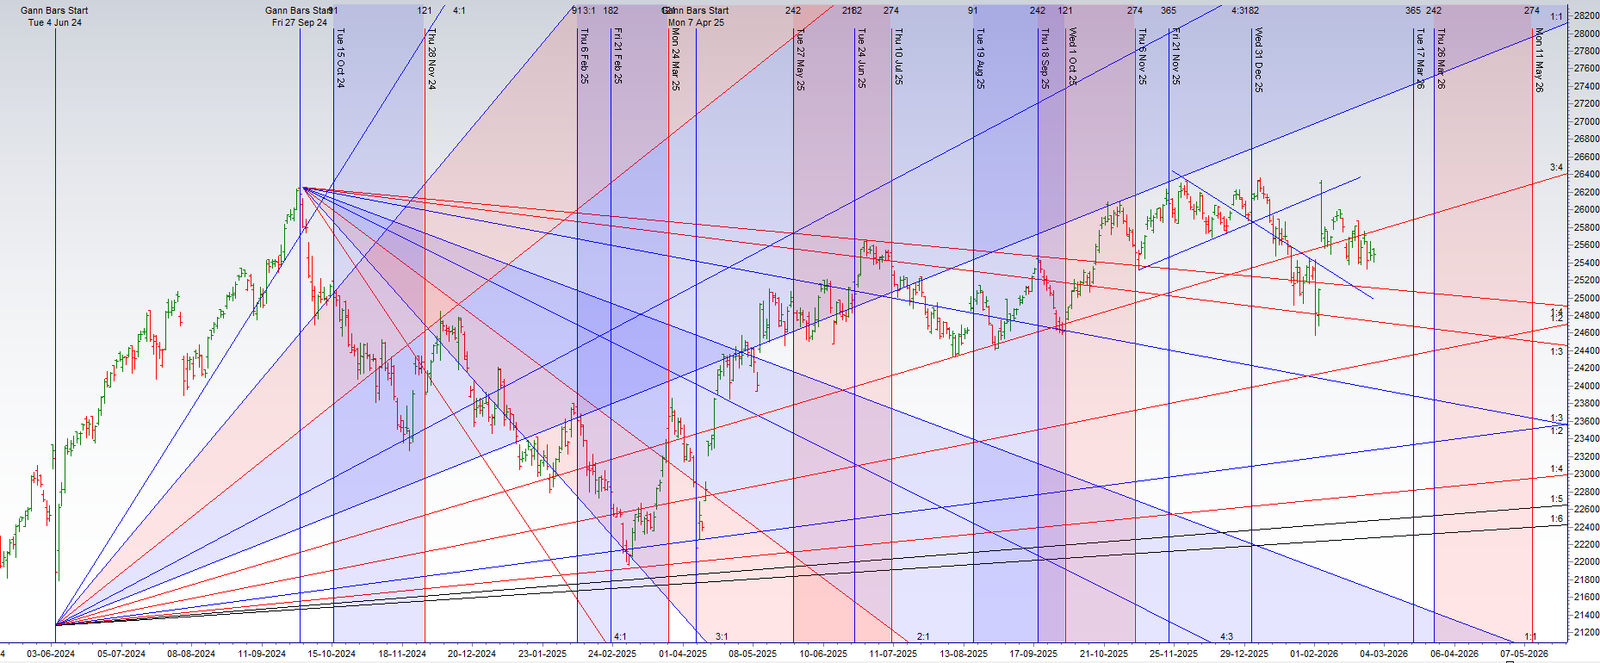
The market has delivered a decisive verdict: the bullish reversal has failed. The Nifty’s inability to even test the critical 25,632 resistance level is a sign of profound weakness. The bears remain in absolute command, having successfully pushed the price down to the 25,400 support before a minor pullback. The battle for trend control is over, and the focus now shifts to how deep this new bearish leg can go, with all eyes on the crucial monthly closing price.
The powerful astrological backdrop remains in full effect. The chaotic, reversal-prone energy of Mercury Retrograde and the frustrated, agitated tension of the Mars-Saturn aspect continue to promise a “trending move,” and yesterday’s action has now confirmed that this trend is to the downside.
The Bearish Objective: The Quest for a Perfect Monthly Doji
The bears have a clear and technically significant objective for the final day of the month. A gap-down opening is the probable scenario, which will immediately put the day’s critical support levels to the test.
-
The Breakdown Trigger: The most important level to watch is 25,400. A decisive break below this support is the definitive signal that the bears are initiating the next major wave of selling.
-
The Ultimate Target: The primary objective for the bears is to drive the price down to the February month open at 25,333. A monthly close near this level would achieve a powerful technical feat: it would “paint the chart” with a perfect monthly Doji candlestick. This would be a monument to a full month of indecision and would perfectly set the stage for a major, volatility-driven trend in the month ahead.
The High-Stakes Battleground for a New Trend
While the bearish case is dominant, the bulls have one last line of defense. The entire day’s trend will be fought over two clearly defined breakout and breakdown levels.
The Bearish Breakdown Scenario
-
The Trigger: A decisive and sustained move below 25,400.
-
The Analysis: A break of this support level is a definitive signal that the bearish trend is accelerating, with the path opening towards the 25,333 target and potentially lower.
The Unlikely Bullish Breakout Scenario
-
The Trigger: A decisive and sustained move above 25,555.
-
The Analysis: Only a powerful and unexpected breakout above this overhead resistance could invalidate the overwhelming bearish case. This would be a sign of a major short squeeze and a reversal of sentiment.
Conclusion
The bulls have failed their test, and the bears are now firmly in control of the market’s trajectory. The astrological environment is ripe for a powerful, trending move to the downside. The immediate battle will be for control of the 25,400 support. A breakdown here is the highest probability outcome, with the bears aiming for a technically perfect and psychologically damaging monthly close near 25,333. Prepare for a decisive and potentially high-velocity session.
Nifty Dec Futures Open Interest Volume stood at 1.30 lakh cr , witnessing addition of 1.1 Lakh contracts. Additionally, the increase in Cost of Carry implies that there was addition of SHORT positions today.
Nifty Advance Decline Ratio at 26:24 and Nifty Rollover Cost is @25628 closed above it.
In the cash segment, Foreign Institutional Investors (FII) sold 3465 cr , while Domestic Institutional Investors (DII) bought 5031 cr
The Nifty options market is radiating signals of intense bearish pressure and a market firmly in the grip of sellers. A profoundly negative Put-Call Ratio (PCR) of just 0.69 is the definitive evidence of this, indicating that call open interest has massively overwhelmed that of puts. This is the unmistakable signature of a market where aggressive call writers have built a colossal wall of resistance, reflecting their supreme confidence that any attempt at a rally will be brutally suppressed.
This intense bearish pressure has pinned the market exactly at its financial center of gravity, the Max Pain point of 25,500. With the spot price trading at 25,496, the index is perfectly trapped, confirming the absolute control of large institutional option sellers who are profiting from this stalemate.
A deep dive into the participant data reveals the engine behind this bearish structure:
-
Foreign Institutional Investors (FIIs) executed a classic and direct bearish strategy. They were significant net sellers of call options (building the resistance wall) and net buyers of put options (actively buying insurance and betting on a fall). This two-pronged action shows clear institutional conviction that the risk is firmly to the downside.
This has forged a clear and formidable battlefield:
-
Resistance: A “Great Wall of Calls” is located at the 25,600 strike, which now acts as the primary and most formidable ceiling. The 25,500 Max Pain level is the immediate resistance.
-
Support: On the downside, a significant support floor has been built by put writers at 25,300. The ultimate line of defense and psychological support is located at 25,000.
In conclusion, the Nifty is locked in a bear grip, dominated by institutional selling pressure. The path of least resistance is firmly sideways to down. The market is trapped in a high-tension range, and any relief rally is likely to be sold into aggressively at the 25,500-25,600 zone.
For Positional Traders, The Nifty Futures’ Trend Change Level is At 25562. Going Long Or Short Above Or Below This Level Can Help Them Stay On The Same Side As Institutions, With A Higher Risk-reward Ratio. Intraday Traders Can Keep An Eye On 25636, Which Acts As An Intraday Trend Change Level.
Nifty Spot – Intraday Chart Observation
Technical Setup: The index is approaching critical breakout levels. Watch these zones for price action confirmation:
-
Strength (Upside): Momentum is expected to pick up if Nifty sustains above 25531. In this scenario, the immediate resistance levels are 25576, 25610 and 25666
-
Weakness (Downside): The trend technically weakens if the index slips below 25444 This could open the path towards support levels at 25400, 25372 and 25313.
Wishing you good health and trading success as always.As always, prioritize your health and trade with caution.
As always, it’s essential to closely monitor market movements and make informed decisions based on a well-thought-out trading plan and risk management strategy. Market conditions can change rapidly, and it’s crucial to be adaptable and cautious in your approach.
► Join Youtube channel : Click here
► Check out Gann Course Details: W.D. Gann Trading Strategies
► Check out Financial Astrology Course Details: Trading Using Financial Astrology
► Check out Gann Astro Indicators Details: Gann Astro Indicators