


A Market in Full Retreat: FIIs Take Profits as Retail Capitulates in a Mass Exodus
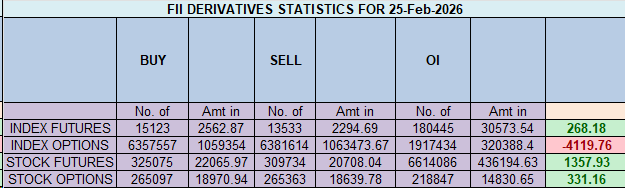
On February 25, 2026, the Nifty Index Futures market gave a profound and powerful signal of a major trend reaching its final, exhaustive stage. While the headline figure showed a deceptively neutral stance from Foreign Institutional Investors (FIIs) with a net buy of 986 contracts, the true, dramatic story was a tale of mass exodus from all sides, confirmed by a colossal collapse in net Open Interest (OI) of 2,724 contracts.
This is not the data of a healthy market finding a bottom. This is the unmistakable signature of a market trend dying from complete exhaustion, where both the winners and the losers are rushing for the exits at the same time.
Decoding the Data: The Anatomy of a Market Reset
1. The FIIs’ “Deceptive” Buy: A Masterful Profit-Taking Operation
The granular FII data unmasks their true, brilliant strategy. Their “buy” number was not a vote of confidence in a new bull run. It was a strategic exit.
-
They covered (bought back) a massive 2,904 short contracts, taking significant profits off the table from their successful bearish campaign.
-
Simultaneously, they covered (sold) 1,314 long contracts.
The only reason they were net buyers is because their profit-taking on shorts was more than double the size of their long liquidation. This is a massive de-risking and profit-realization operation, not a new bullish initiative. Their overall positioning remains profoundly bearish (21:79), proving they have not flipped their view; they have simply cashed in their winnings.
2. The Main Event: The Complete Client Surrender
The most important market event of the day was the behavior of the retail clients. They signaled a complete psychological breakdown.
-
The Longs Capitulate: They covered (sold) a staggering 3,311 long contracts. This is a mass liquidation event, a classic signal of maximum pain where the longs who held on can no longer bear the pressure and are forced to sell.
-
The Bears Emerge Late: A different group of clients, now convinced of the downtrend, added 1,643 new short contracts, becoming the new “trapped” fuel for a potential reversal.
3. The OI Collapse: The Battlefield Empties
The huge drop in Open Interest is the irrefutable evidence that this was a session of mass deleveraging. Both the primary bulls (Clients) and the primary bears (FIIs) were aggressively closing their legacy positions. A market that rallies or stabilizes on collapsing OI is a “hollow” market, one that is exceptionally weak and fragile.
Key Implications for the Market
-
The Aggressive Bear Trend is Over: The primary engine of the decline—aggressive FII shorting—has now reversed into profit-taking. The selling pressure has climaxed.
-
The Risk has Inverted to a Violent Short Squeeze: With the old longs having capitulated and a fresh crop of retail shorts now trapped, the conditions are perfect for a ferocious short squeeze. The supply of natural sellers is exhausted.
-
A Major Bottoming Process is Underway: This type of dual-sided, high-volume capitulation is the classic signature of a major market low being formed.
-
A Brittle and Extremely Fragile Market: Once the forced short-covering is complete, the primary source of buying pressure will evaporate instantly. This leaves the market exceptionally vulnerable to a sudden and violent reversal, often called a “rug pull.”
Conclusion
Disregard the headline FII “buy” figure. The dominant and undeniable story is of a massive short squeeze and a masterful profit-taking operation by the FIIs, enabled by the capitulation of retail clients. The old bear trend is over, but the new rally is built on the most fragile foundation possible. The risk of a sharp reversal is now extremely high.
Last Analysis can be read here
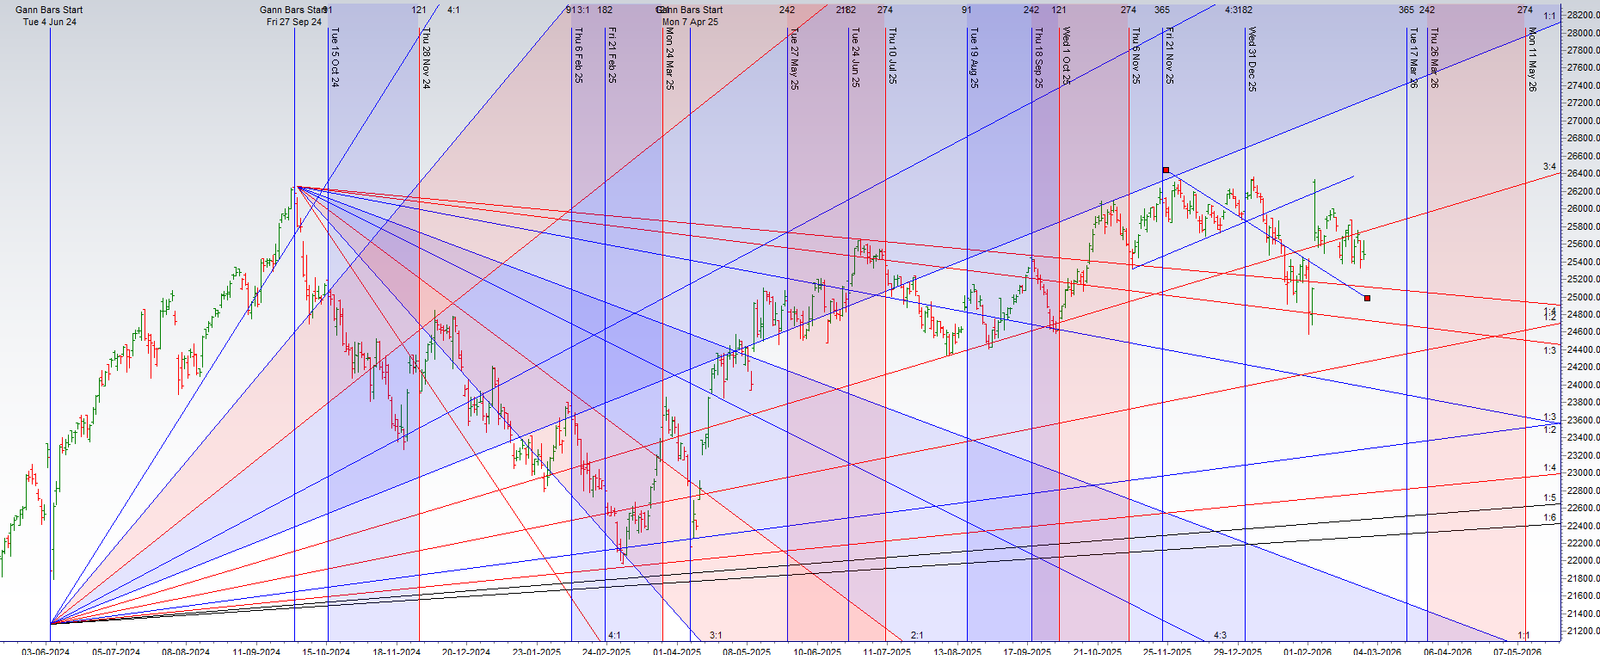
The Nifty is perfectly coiled at a critical and high-stakes inflection point. The market has just formed a perfect Doji candlestick pattern, the ultimate technical signature of a market in a state of absolute equilibrium and profound indecision. The bulls and bears have fought to a complete standstill. This technical pause is not random; it has occurred on the eve of a major astrological event: Mercury turning retrograde. In market analysis, this is a classic “price-time” setup, signaling that the current state of indecision is about to be violently resolved.
The short-term technical picture has improved with the successful filling of the recent gap, but now the market faces its ultimate test, which is being amplified by the potent energy of the retrograde.
1. The Astrological Catalyst: The Mercury Retrograde Verdict
As explained in detail in your video, Mercury Retrograde is a notorious catalyst for volatility, re-evaluation, and sharp reversals. Trends that seem stable can suddenly change course. This retrograde energy will be the primary driver of the market’s next move, forcing a definitive resolution of the Doji’s indecision.
Your identification of its impact on IT stocks is the crucial inter-market key. Strength and a potential rise in the IT sector could provide the powerful underlying support needed to lift the entire Nifty index, acting as a major bullish tailwind.
2. The Definitive Battleground: The 25,632 “Line in the Sand”
The confluence of the Doji pattern and the Mercury Retrograde has focused the entire market’s attention on a single, make-or-break price level. This is the fulcrum upon which the entire trend for the next few days will pivot. The battle for 25,632 is not just an intraday skirmish; it is the battle for control of the trend itself.
The two scenarios are now drawn with absolute clarity:
-
The Bullish Reversal Scenario (A Close > 25,632): This is the bulls’ primary and only objective. Achieving a decisive close above this level would be a major technical victory. It would signal that the current downtrend is over, turning the Doji into a classic reversal pattern and unleashing a new rally towards 25,695 and 25,758.
-
The Bearish Continuation Scenario (A Failure at 25,632): The bears will treat this level as a formidable fortress. An inability by the bulls to achieve a close above it would confirm that the bearish momentum is still in control. This would signal a powerful rejection, setting the stage for a break of the critical support zone at 25,400-25,372, likely triggering a new and accelerated leg down.
3. The Intraday Tactical Plan
With a Mercury Retrograde promising a day of potential false moves and high volatility, the tactical plan must be clear and disciplined. The first 15 minutes’ high and low will be the ultimate, unbiased compass, cutting through the initial retrograde-driven noise and revealing the session’s true, dominant trend.
Conclusion
The Nifty is at a major crossroads. A powerful technical pattern of indecision has aligned perfectly with a major astrological catalyst for reversal. The entire fate of the short-term trend rests on the battle for 25,632. Watch this level with extreme focus, and use the 15-minute range to confirm which side is winning this high-stakes fight.
Nifty Dec Futures Open Interest Volume stood at 1.29 lakh cr , witnessing liquidation of 4.3 Lakh contracts. Additionally, the increase in Cost of Carry implies that there was addition of SHORT positions today.
Nifty Advance Decline Ratio at 37:13 and Nifty Rollover Cost is @25628 closed above it.
In the cash segment, Foreign Institutional Investors (FII) bought 880 cr , while Domestic Institutional Investors (DII) bought 596 cr
The Nifty options market is signaling a state of extreme bearish control and high-stakes tension. A profoundly negative Put-Call Ratio (PCR) of just 0.64 indicates that the open interest in call options is vastly greater than in puts. This is the unmistakable signature of a market dominated by aggressive call writers, reflecting their high conviction that any attempt at a rally will be met with overwhelming selling pressure.
This intense bearish sentiment has pushed the market below its financial center of gravity, the Max Pain point of 25,500. With the spot price trading at 25,482, the index is in a position of technical weakness, confirming the firm control of the sellers and reinforcing the market’s negative bias.
A deep dive into the participant activity reveals a powerful divergence in strategy:
-
Foreign Institutional Investors (FIIs) are aggressively betting on a range. They were significant net sellers of both call options and put options. This classic “short strangle” strategy shows their high confidence that the market will remain trapped between two defined price points, allowing them to profit from decaying volatility.
-
Retail, in a direct countermove, were the primary net buyers of both calls and puts, betting on a breakout in either direction.
This institutional strangle has forged a clear and formidable battlefield:
-
Resistance: A “Great Wall of Calls” is located at the 25,600 strike, which now acts as the primary and most formidable ceiling.
-
Support: A significant support floor has been built by put writers (led by FIIs) at 25,300. The ultimate line of defense and psychological support is located at 25,000.
In conclusion, the Nifty is in a bear grip, with FIIs betting heavily on a continued range. The market is trapped, and any relief rally is likely to be sold into aggressively at the 25,500-25,600 zone.
For Positional Traders, The Nifty Futures’ Trend Change Level is At 25526. Going Long Or Short Above Or Below This Level Can Help Them Stay On The Same Side As Institutions, With A Higher Risk-reward Ratio. Intraday Traders Can Keep An Eye On 25697, Which Acts As An Intraday Trend Change Level.
Nifty Spot – Intraday Chart Observation
Technical Setup: The index is approaching critical breakout levels. Watch these zones for price action confirmation:
-
Strength (Upside): Momentum is expected to pick up if Nifty sustains above 25531. In this scenario, the immediate resistance levels are 25576, 25610 and 25666
-
Weakness (Downside): The trend technically weakens if the index slips below 25444 This could open the path towards support levels at 25400, 25372 and 25313.
Wishing you good health and trading success as always.As always, prioritize your health and trade with caution.
As always, it’s essential to closely monitor market movements and make informed decisions based on a well-thought-out trading plan and risk management strategy. Market conditions can change rapidly, and it’s crucial to be adaptable and cautious in your approach.
► Join Youtube channel : Click here
► Check out Gann Course Details: W.D. Gann Trading Strategies
► Check out Financial Astrology Course Details: Trading Using Financial Astrology
► Check out Gann Astro Indicators Details: Gann Astro Indicators