


Disclaimer : This analysis represents the highest-probability forecast derived from expert, multi-decade historical evaluation of astrological signatures and their documented correlation with market psychology and price action.
No Guarantee: This is not a guarantee of future market performance. Financial markets are influenced by numerous dynamic and unpredictable real-world factors. All trading and investment activities carry significant risk, including the potential loss of principal.
Educational Purpose Only :This content is strictly for informational and educational purposes and should not be construed as financial advice or a recommendation to buy, sell, or trade any financial instrument.
Consult a Professional :We strongly advise you to consult a qualified financial advisor before making any investment decisions. Any actions you take based on this analysis are solely your responsibility. We assume no liability for any financial profits or losses that may occur.
Gold Theme: The Eclipse Deception
This week’s narrative is not a straightforward trend but a sophisticated deception, orchestrated by a rare Annular Solar Eclipse. The market begins under a powerfully bullish illusion, fueled by positive news flow and rate-cut optimism, designed to draw in maximum participation on the long side. Gold’s current position above the psychological $5,000 level acts as the bait. The week’s powerful astrological setup, climaxing on Tuesday, is engineered to look like the start of a new, sustainable breakout. This is a trap. The true purpose of the initial ascent is to create the necessary height for a significant fall.
For a Detailed Astro Forecast with Neural Analysis Please watch the below video
The Silver Flash Crash of February 12: Dark Pools, Tape Latency, and the Science of the “Zero Volume” Trap
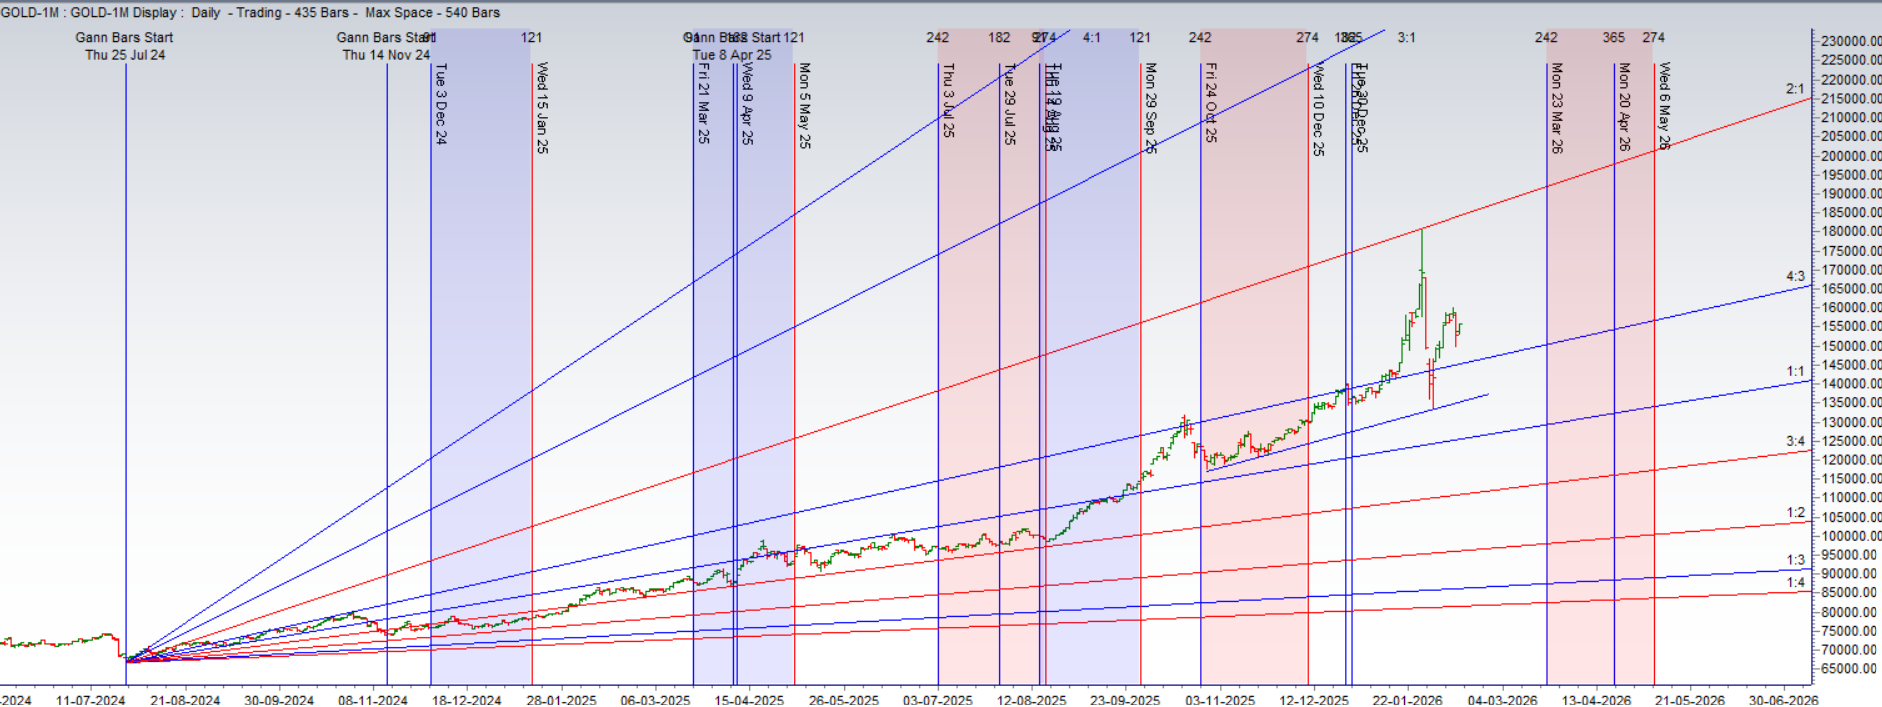
MCX GOLD Gann Angle Chart
Gold formed an Inside Br pattern
MCX GOLD Supply Demand Zone
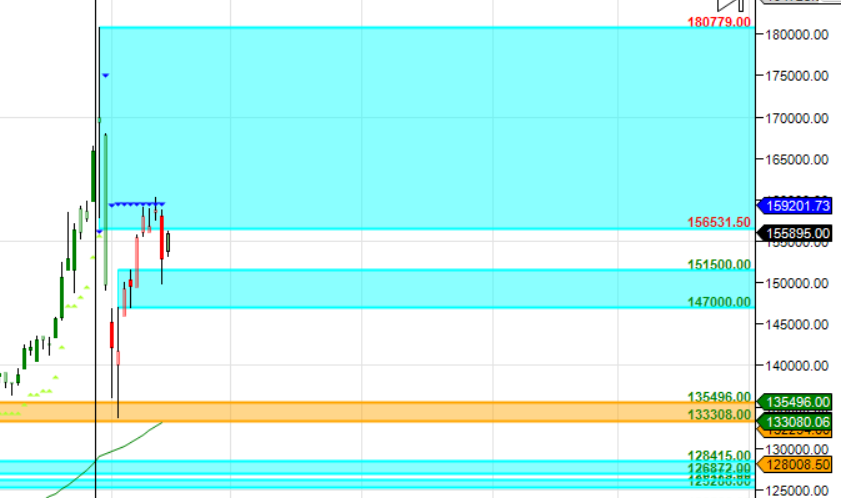
MCX GOLD Supply Demand Chart : Demand in range of 149-150 K , Supply in range of 157-158 K
MCX GOLD Harmonic Analysis
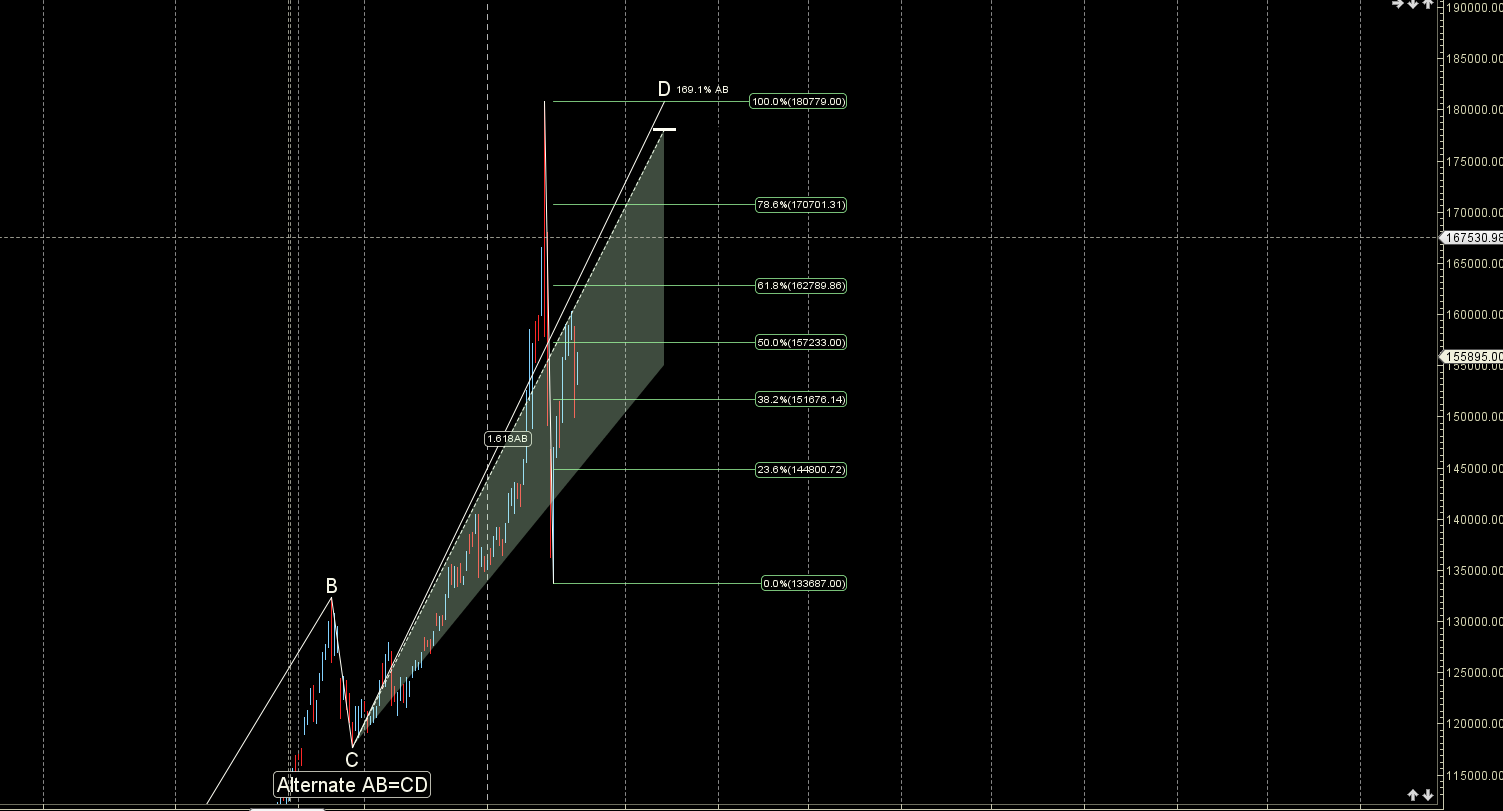
Heading towards 157K
MCX GOLD Weekly
Gold reacted from Weekly AF Support zone formed a perfect Weekly Doji
MCX GOLD Monthly
157 K Monthly Resistance and 148 K Monthly Support.
GOLD Astro/Gann Trend Change Date
Key Pivot Dates: Watch 17 Feb
GOLD Weekly Levels
Weekly Trend Change Level:153771
Weekly Resistance: 154991,155935,157050,158166
Weekly Support: 152664,151472,150357,149241
Levels Mentioned are for Current Month Future
Learn More:
W.D. Gann Trading Strategies – Learn how to decode markets using price, time, and geometry.
Trading Using Financial Astrology – Discover how planetary motion impacts market behavior and how to trade it effectively.
Ready to Trade Like a Time-Master?
Join our one-on-one mentorship to master astro-timing, Gann analysis, and institutional-grade setups.