


Disclaimer
This analysis represents the highest-probability forecast derived from expert, multi-decade historical evaluation of astrological signatures and their documented correlation with market psychology and price action.
No Guarantee
This is not a guarantee of future market performance. Financial markets are influenced by numerous dynamic and unpredictable real-world factors. All trading and investment activities carry significant risk, including the potential loss of principal.
Educational Purpose Only
This content is strictly for informational and educational purposes and should not be construed as financial advice or a recommendation to buy, sell, or trade any financial instrument.
Consult a Professional
We strongly advise you to consult a qualified financial advisor before making any investment decisions. Any actions you take based on this analysis are solely your responsibility. We assume no liability for any financial profits or losses that may occur.
Theme for Sensex: The Euphoric Peak into The Time Cycle Reversal
The theme for the Sensex is “The Euphoric Peak into The Time Cycle Reversal.” The index is in a confirmed and powerful uptrend. The bullish technicals (above all MAs, PCR > 0.8), strong macro news, and a low VIX environment are providing the fuel for a powerful continuation move. The gap-up opening will feed this narrative, driving the index towards key resistance levels. However, the week is structured around the major reversal point on Thursday, the Gann Date and Mercury-Node swing point. This setup is designed to create a classic “blow-off top” or an exhaustion peak where the final buyers are pulled in right before the trend reverses. The powerful Bayer Rules 6 and 15 at the end of the week add significant weight to this reversal thesis, suggesting the subsequent decline will be sharp and technically significant.
For a Detailed Day by Day Forecast with Neural Analysis Please watch the below video
SENSEX Harmonic Pattern
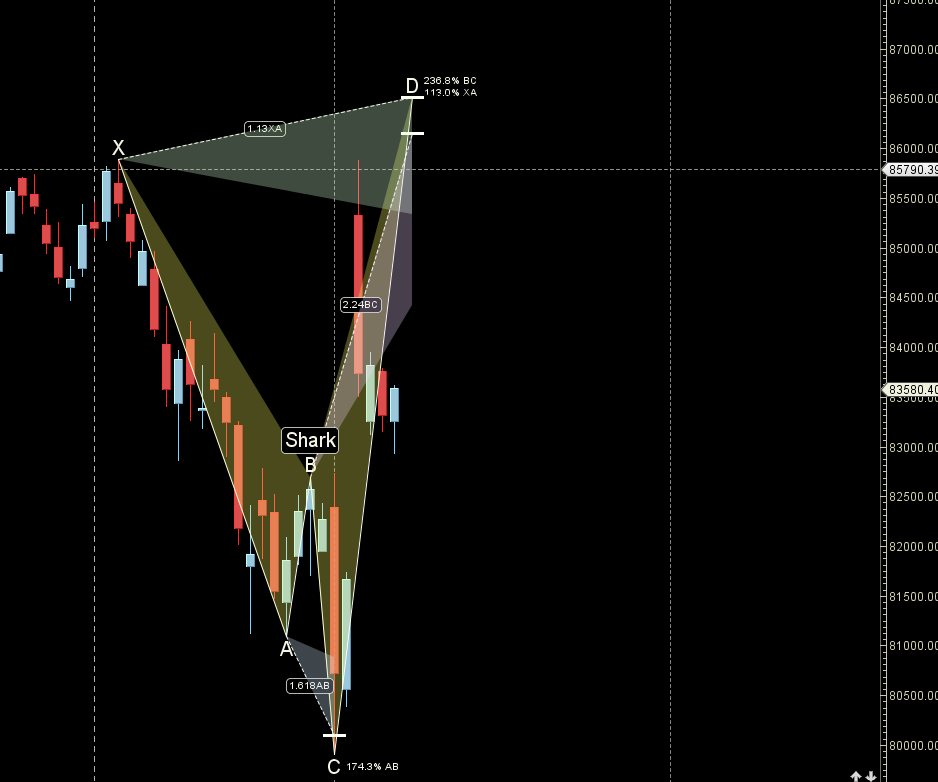
Sensex shark pattern completed now above 84000 we can see a sharp counter trend rally
SENSEX Gann Angles
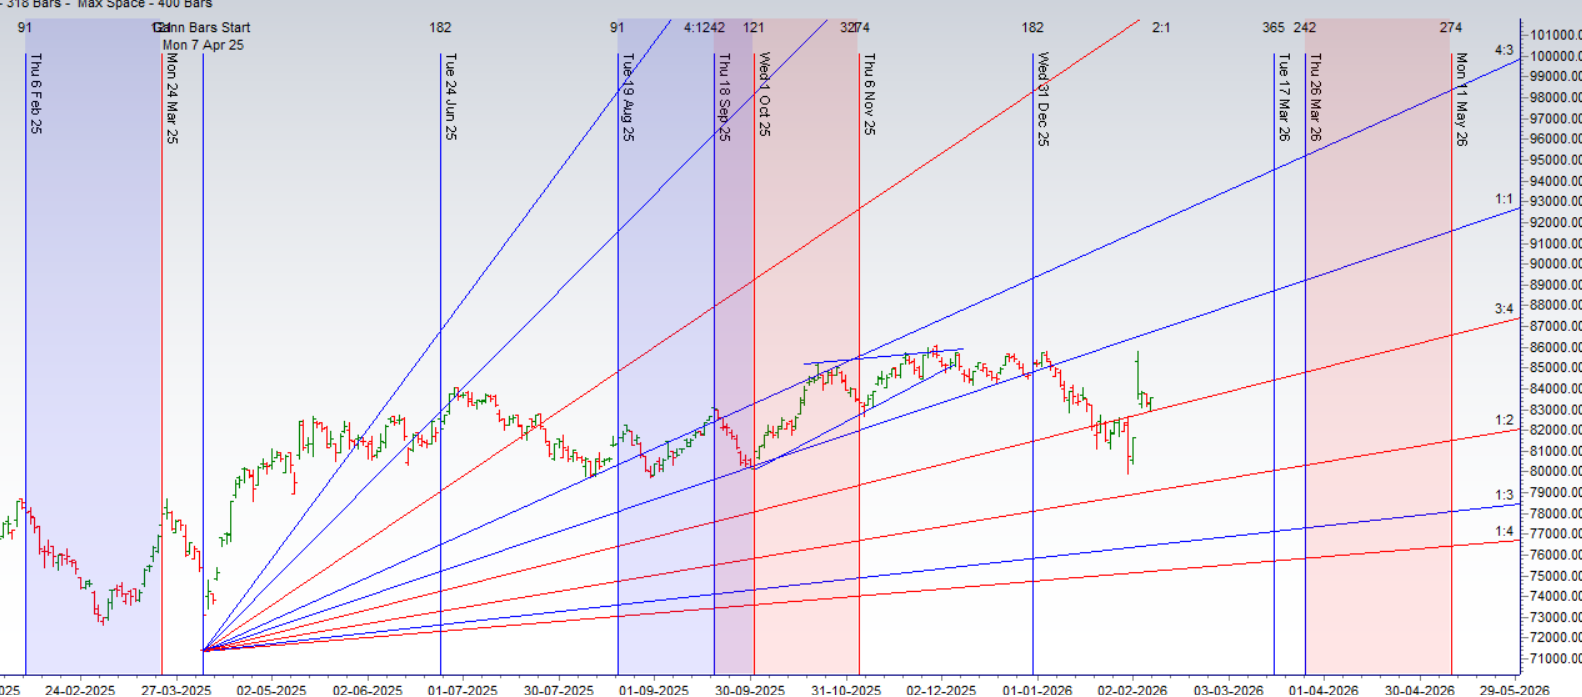
Sensex hold its 3×4 gann angle
SENSEX Supply and Demand

Self Explanatory Chart
SENSEX Time Analysis Pressure Dates
Key Pivot Dates: Watch 12 Feb
SENSEX Weekly Chart
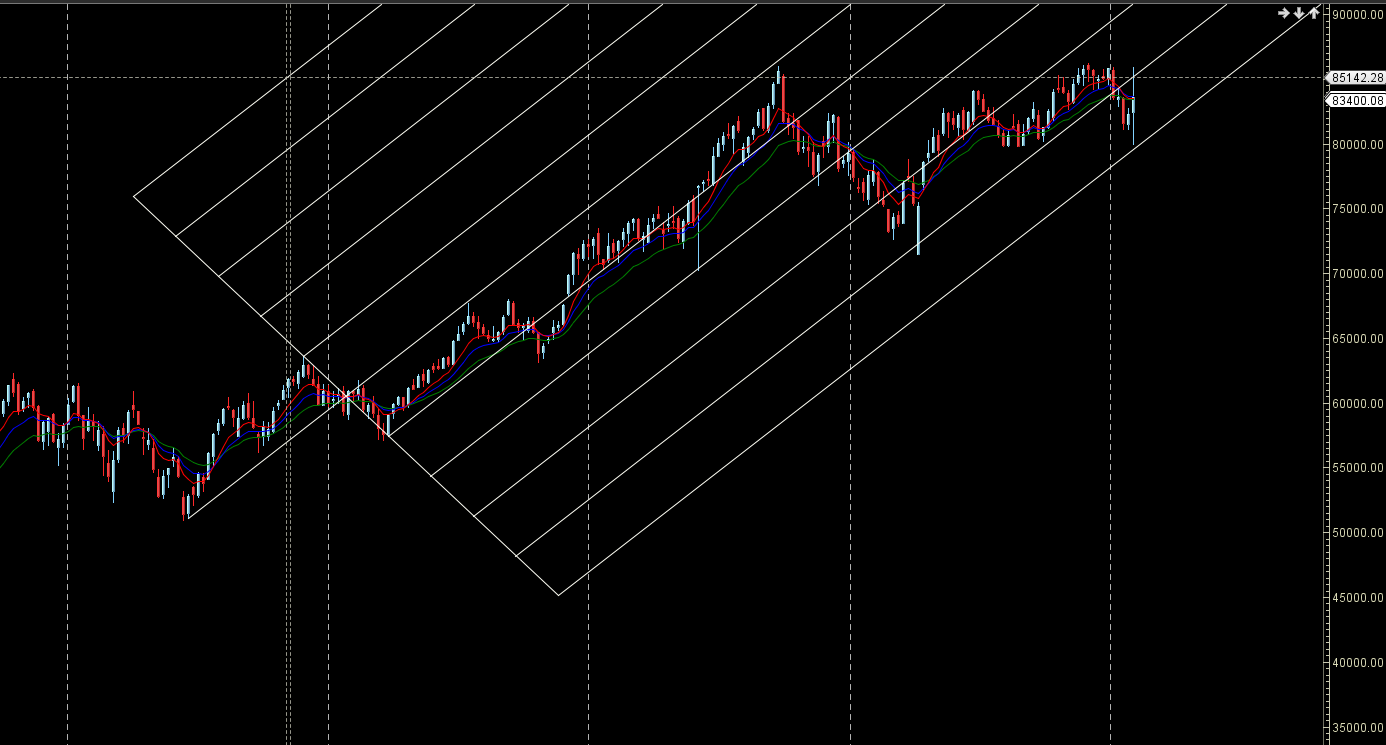
Price bounced from its weekly Support and Resistance
SENSEX Monthly Charts
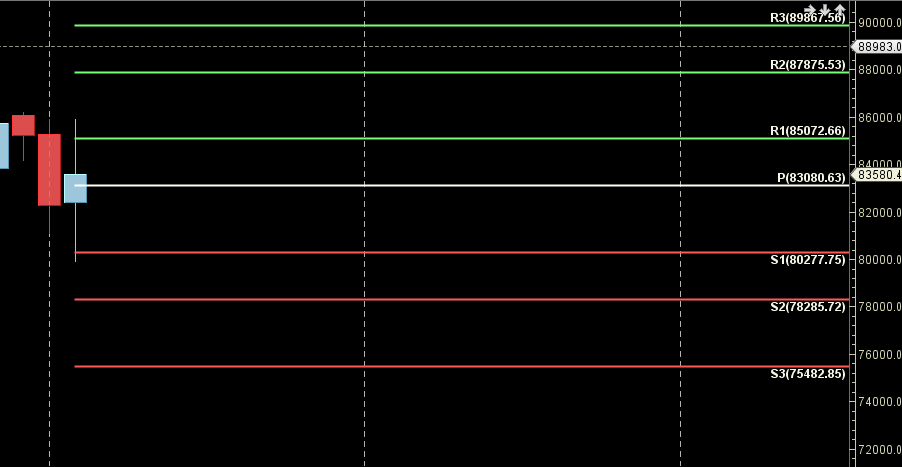
85072 is Monthly resistance zone 83080 is Support zone.
SENSEX Weekly Levels
SENSEX Trend Deciding Level: 83686
SENSEX Resistance: 83832 83978 84123 84269 84415
SENSEX Support: 83540 83395 83290 83103 82957
Levels mentioned are SENSEX Spot
Learn More:
W.D. Gann Trading Strategies – Learn how to decode markets using price, time, and geometry.
Trading Using Financial Astrology – Discover how planetary motion impacts market behavior and how to trade it effectively.
Ready to Trade Like a Time-Master?
Join our one-on-one mentorship to master astro-timing, Gann analysis, and institutional-grade setups.
Call: 09985711341
Email: bhandaribrahmesh@gmail.com