


A Masterclass in Deception: FIIs Take Massive Profits in a Retail-Fueled Short Squeeze
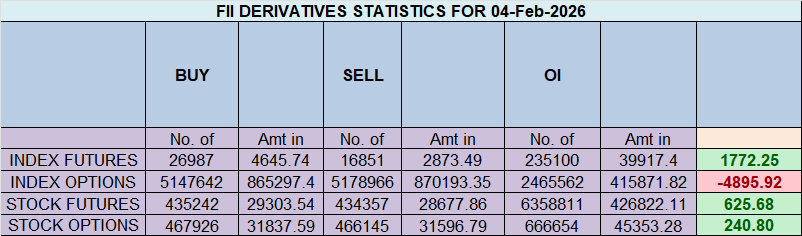
On February 4, 2026, the Nifty Index Futures market painted a spectacular, yet deceptive, picture of institutional buying. While the headline showed a strong net buy of 3,614 contracts by Foreign Institutional Investors (FIIs), a deeper look reveals this was not a new vote of confidence. Instead, it was a masterful and brutal execution of a massive profit-taking operation, conducted in the midst of a full-blown short squeeze.
The day’s most critical and revealing event was the massive collapse in net Open Interest (OI) of 2,036 contracts. This is the definitive signature of an unhealthy, unsustainable rally built on the weak foundation of exiting players, not the strong foundation of new buyers.
Decoding the Data: The Anatomy of a Squeeze
1. The FIIs’ “Bullish” Disguise: Cashing in the Winnings
The FII granular data unmasks their true, brilliant strategy. Their “buy” number was almost entirely driven by the covering of a colossal 6,267 short contracts.
-
This is not a new bull bet; it is the strategic closing of an immensely profitable bear campaign. After riding the trend down, they are using the market’s upward panic to exit their positions at favorable prices.
-
The definitive proof is in their final positioning: they remain profoundly bearish at 17% long versus 83% short (ratio 0.23). They have not flipped their view; they have simply realized enormous profits.
2. The Main Event: A Story of Client Capitulation and Entrapment
The retail clients were on the wrong side of every move, showcasing classic, end-of-trend psychology:
-
The Surrendering Bulls: One group of long-time bulls finally threw in the towel, covering 2,727 long positions in a classic capitulation event, selling right into the developing rally.
-
The Newly Trapped Bears: An even larger group, convinced by the recent downtrend, turned bearish at the worst possible time, adding 3,966 new short contracts.
This created the perfect storm: the FIIs needed to buy back their shorts, and the newly bearish clients were the perfect, willing sellers. The clients are now trapped, providing the fuel for the squeeze.
3. The OI Collapse: A Hollow Rally
The significant drop in Open Interest is the irrefutable evidence that the market is “hollowing out.” The rally is not being driven by new money with bullish conviction; it’s an accounting exercise of old players closing their books. A rally on collapsing OI is the weakest and most dangerous type of rally.
Key Implications for the Market
-
A Textbook Short Squeeze: The rally is being fueled by the forced, panicked buying of trapped short-sellers, not by new, confident bulls.
-
The Primary Bear Trend is Exhausted: The main engine of the decline—aggressive FII shorting—is now reversing as they take profits.
-
A Brittle and Extremely Fragile Market: Once the forced short-covering is complete, the primary source of buying pressure will evaporate instantly. This leaves the market exceptionally vulnerable to a sudden and violent reversal, often called a “rug pull.”
-
The Bottoming Process Has Begun: This chaotic price action is typical of a major market bottom being formed. It is a process, not a clean event, and will likely remain highly volatile.
Conclusion
Disregard the headline FII “buy” figure. The dominant story is a massive short squeeze and a masterful profit-taking operation by the FIIs, enabled by the capitulation and entrapment of retail clients. The old bear trend is over, but the new rally is built on the most fragile foundation possible. The risk of a sharp reversal is now extremely high.
Last Analysis can be read here
The market has delivered a classic and painful “buy the rumor, sell the news” event. The overwhelmingly positive news of the US-India Trade Deal produced the expected big gap-up opening, but the bulls’ victory was short-lived. The rally was brutally sold into, fueled by weekly expiry pressure, culminating in a decisive failure to close above the critical 26,000 level. This is not just a failed rally; it is a textbook bull trap, signaling a potential major reversal of trend.
This technical weakness is now set to be amplified by a perfect storm of two powerful and volatile astrological events.
1. The Uranian Shockwave and the IT Litmus Test
Today’s first major catalyst is Uranus turning Direct. Uranus is the planet of technology, shocks, and sudden, unexpected events. As forecast, its energy is already manifesting in the Technology stocks, with the sell-off in Infy and Wipro ADRs being a direct reaction to the “Uranian” shock of a disruptive new AI tool from Anthropic.
However, your analysis provides the professional’s trading plan: this news has created an environment of peak pessimism in the IT sector. Therefore, the first 15 minutes’ low of IT stocks will be a critical litmus test. A failure to break this low could signal that the worst of the news is priced in, potentially triggering a sharp, contrarian recovery rally in the sector.
2. The Bearish Timer: Bayer Rule 2 and the “Big Move”
Adding a layer of direct bearish pressure is the activation of Bayer Rule 2. This historically significant rule states that a “trend goes down within 3 days” when the speed difference between Mars (aggression) and Mercury (trading) reaches a specific point. With both planets involved, this is a clear warning for a “Big Move” with a distinct downward bias. The market is now on a timer, with a pre-calculated catalyst for a decline.
3. The Definitive Battleground: The Last Stand for the Bulls
This powerful confluence of a failed breakout and multiple bearish catalysts has pushed the market to a critical and final support zone. The entire session, and potentially the entire trend, will now be decided by the battle at this level.
-
The Bullish Last Stand (25,472 – 25,500): This is the fortress that the bulls must defend. A successful hold of this range would be a major victory, absorbing all the bearish pressure and creating the potential for a powerful relief rally back to 25,900.
-
The Bearish Knockout Blow (A Close < 25,450): For the bears, their objective is to press their advantage. A decisive close below 25,450 would signal that the bulls’ final line of defense has been shattered. This would be a major technical breakdown, confirming the bull trap and likely unleashing a rapid fall towards 25,300 and 25,225.
Conclusion
The market is in a precarious and dangerous state. A major bullish catalyst has failed, creating a technical bull trap. Two powerful astrological events are now providing the fuel for a potential trend reversal. The battle lines are drawn with absolute clarity at the 25,472-25,500 support zone. A hold here could stage a recovery, but a break below will likely trigger the next major leg down. Prepare for a high-volatility session where these critical levels will be tested with force.
The market has just delivered a masterclass in sectoral rotation and resilience. As forecast, the Uranus Turning Direct aspect unleashed its disruptive energy with surgical precision on the IT sector, which took a significant beating. However, in a classic display of a healthy market’s rotational nature, strength immediately flowed into the Banking sector, which stepped up to compensate for the tech weakness and successfully guided the Nifty to a resilient close in the green.
This internal tug-of-war has neutralized the immediate bearish threat from the IT sector’s woes and has brought the Nifty to a new, and absolutely critical, technical battleground. The market’s next move will be determined by the battle for this crucial support zone.
The Definitive Technical Fulcrum: The 25,666 – 25,700 Support Fortress
The entire short-term trend is now balanced on a knife’s edge, defined by this very specific and powerful support zone. The market’s reaction here will determine whether the current resilience is the start of a new rally or just a temporary pause before the next decline.
The battle lines are now drawn with absolute clarity:
-
The Bullish Defense and Continuation: The bulls have one primary mission: defend the 25,666-25,700 zone. A successful hold of this support fortress would be a major victory. It would signal that the market has fully absorbed the weakness from the IT sector and is ready to resume its primary uptrend. A successful defense here puts a rally towards the next major resistance zone of 25,900-25,920 firmly on the table.
-
The Bearish Breakdown and Target: The bears will view the strength in banks as a temporary anomaly. Their goal is to press the overall market weakness and break the bulls’ final line of defense. A decisive breach of the 25,650 level would signal that the support zone has failed. This would be a major technical breakdown, likely triggering a quick and cascading decline towards the next major support at 25,436.
Conclusion
The market has proven its resilience but now faces its most important test. The internal dynamics are a tug-of-war between a wounded IT sector and a strong Banking sector. The entire outcome of this conflict will be decided at the pivotal 25,666-25,700 support zone. The price action here will provide the definitive signal for the market’s next major trend. Watch this zone with extreme focus, as its resolution will likely set the tone for the rest of the week.
Turning Trading Regrets into Tuition: How to Learn from Your Worst Decisions
Traders may watch out for potential intraday reversals at 09:18,10:47,12:25,01:45,02:47 How to Find and Trade Intraday Reversal Times
Nifty Dec Futures Open Interest Volume stood at 1.54 lakh cr , witnessing liquidation of 4.7 Lakh contracts. Additionally, the increase in Cost of Carry implies that there was closeuer of SHORT positions today.
Nifty Advance Decline Ratio at 37:13 and Nifty Rollover Cost is @25405 closed above it.
In the cash segment, Foreign Institutional Investors (FII) bought 29 cr. , while Domestic Institutional Investors (DII) bought 249 cr.
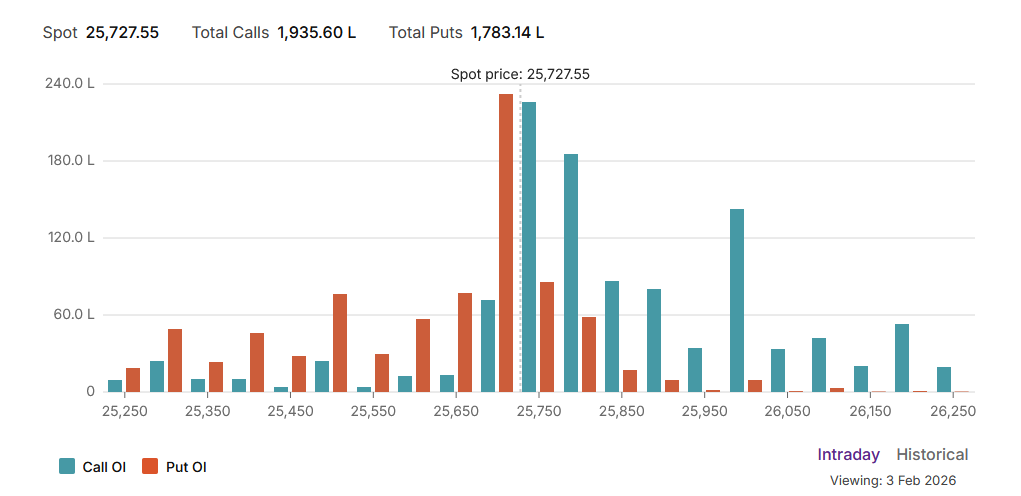
The Nifty options market is in a state of near-perfect balance, with an exceptionally neutral Put-Call Ratio (PCR) of 0.96 indicating a high-stakes standoff between bulls and bears. Neither side holds a clear advantage, creating a tense, range-bound environment. This indecision has trapped the index around the Max Pain point of 25,750. With the spot price trading almost exactly at this level (25,776), the market is pinned at the point of maximum financial pain for option buyers, suggesting a classic stalemate controlled by large institutional option sellers.
The participant data reveals a critical divergence in strategy that is fueling this stalemate:
-
Retail is betting on a breakout in either direction, acting as net buyers of both calls and puts in a classic “long strangle” strategy. They are buying volatility.
-
Foreign Institutional Investors (FIIs), in a direct countermove, are acting as net sellers of put options. This is a confident, bullish-to-neutral stance. They are selling the “insurance” that retail is buying, creating a strong support floor under the market with the belief that a major decline is unlikely.
This conflict has forged a clear and formidable battlefield:
-
Resistance: A massive “Great Wall of Calls” stands at the 25,800 strike, which serves as the immediate and primary ceiling. A break above this faces the next major resistance at 26,000.
-
Support: A very strong support floor, reinforced by FII put selling, is located at the 25,700 strike. The ultimate support for the current range is the huge wall of puts at 25,500.
In conclusion, the Nifty is locked in a classic “pinning” scenario. FIIs are confidently supporting the downside while strong resistance looms overhead. The market is caught in a tight grip between 25,700 and 25,800, and a major catalyst will be required to break this deadlock.
For Positional Traders, The Nifty Futures’ Trend Change Level is At 25422 . Going Long Or Short Above Or Below This Level Can Help Them Stay On The Same Side As Institutions, With A Higher Risk-reward Ratio. Intraday Traders Can Keep An Eye On 25827, Which Acts As An Intraday Trend Change Level.
Nifty Spot – Intraday Chart Observation
Technical Setup: The index is approaching critical breakout levels. Watch these zones for price action confirmation:
-
Strength (Upside): Momentum is expected to pick up if Nifty sustains above 25800. In this scenario, the immediate resistance levels are 25848, 25900, and 25950.
-
Weakness (Downside): The trend technically weakens if the index slips below 25729 . This could open the path towards support levels at 25700, 25666, and 25612.
Wishing you good health and trading success as always.As always, prioritize your health and trade with caution.
As always, it’s essential to closely monitor market movements and make informed decisions based on a well-thought-out trading plan and risk management strategy. Market conditions can change rapidly, and it’s crucial to be adaptable and cautious in your approach.
► Join Youtube channel : Click here
► Check out Gann Course Details: W.D. Gann Trading Strategies
► Check out Financial Astrology Course Details: Trading Using Financial Astrology
► Check out Gann Astro Indicators Details: Gann Astro Indicators